- China
- /
- Trade Distributors
- /
- SZSE:002072
Kairuide Holding Co.,Ltd.'s (SZSE:002072) 26% Dip Still Leaving Some Shareholders Feeling Restless Over Its P/SRatio


To the annoyance of some shareholders, Kairuide Holding Co.,Ltd. (SZSE:002072) shares are down a considerable 26% in the last month, which continues a horrid run for the company. For any long-term shareholders, the last month ends a year to forget by locking in a 52% share price decline.
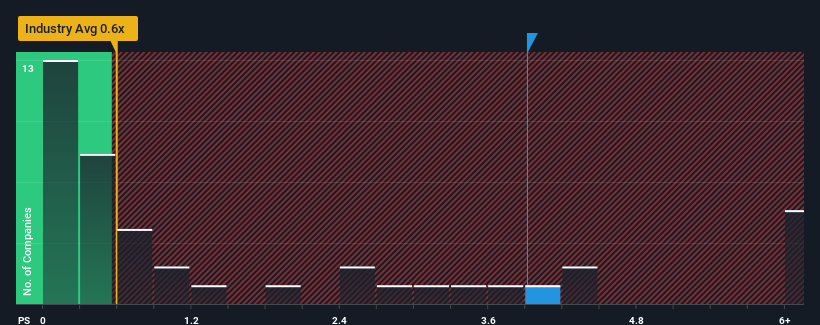
In spite of the heavy fall in price, given around half the companies in China's Trade Distributors industry have price-to-sales ratios (or "P/S") below 0.6x, you may still consider Kairuide HoldingLtd as a stock to avoid entirely with its 3.9x P/S ratio. However, the P/S might be quite high for a reason and it requires further investigation to determine if it's justified.
See our latest analysis for Kairuide HoldingLtd
How Kairuide HoldingLtd Has Been Performing
For example, consider that Kairuide HoldingLtd's financial performance has been poor lately as its revenue has been in decline. It might be that many expect the company to still outplay most other companies over the coming period, which has kept the P/S from collapsing. However, if this isn't the case, investors might get caught out paying too much for the stock.
Want the full picture on earnings, revenue and cash flow for the company? Then our free report on Kairuide HoldingLtd will help you shine a light on its historical performance.What Are Revenue Growth Metrics Telling Us About The High P/S?
There's an inherent assumption that a company should far outperform the industry for P/S ratios like Kairuide HoldingLtd's to be considered reasonable.
Taking a look back first, the company's revenue growth last year wasn't something to get excited about as it posted a disappointing decline of 16%. At least revenue has managed not to go completely backwards from three years ago in aggregate, thanks to the earlier period of growth. Accordingly, shareholders probably wouldn't have been overly satisfied with the unstable medium-term growth rates.
Comparing the recent medium-term revenue trends against the industry's one-year growth forecast of 15% shows it's noticeably less attractive.
With this in mind, we find it worrying that Kairuide HoldingLtd's P/S exceeds that of its industry peers. Apparently many investors in the company are way more bullish than recent times would indicate and aren't willing to let go of their stock at any price. There's a good chance existing shareholders are setting themselves up for future disappointment if the P/S falls to levels more in line with recent growth rates.
The Bottom Line On Kairuide HoldingLtd's P/S
Even after such a strong price drop, Kairuide HoldingLtd's P/S still exceeds the industry median significantly. Generally, our preference is to limit the use of the price-to-sales ratio to establishing what the market thinks about the overall health of a company.
Our examination of Kairuide HoldingLtd revealed its poor three-year revenue trends aren't detracting from the P/S as much as we though, given they look worse than current industry expectations. Right now we aren't comfortable with the high P/S as this revenue performance isn't likely to support such positive sentiment for long. Unless there is a significant improvement in the company's medium-term performance, it will be difficult to prevent the P/S ratio from declining to a more reasonable level.
Having said that, be aware Kairuide HoldingLtd is showing 1 warning sign in our investment analysis, you should know about.
If you're unsure about the strength of Kairuide HoldingLtd's business, why not explore our interactive list of stocks with solid business fundamentals for some other companies you may have missed.
Valuation is complex, but we're here to simplify it.
Discover if Kairuide HoldingLtd might be undervalued or overvalued with our detailed analysis, featuring fair value estimates, potential risks, dividends, insider trades, and its financial condition.
Access Free AnalysisHave feedback on this article? Concerned about the content? Get in touch with us directly. Alternatively, email editorial-team (at) simplywallst.com.
This article by Simply Wall St is general in nature. We provide commentary based on historical data and analyst forecasts only using an unbiased methodology and our articles are not intended to be financial advice. It does not constitute a recommendation to buy or sell any stock, and does not take account of your objectives, or your financial situation. We aim to bring you long-term focused analysis driven by fundamental data. Note that our analysis may not factor in the latest price-sensitive company announcements or qualitative material. Simply Wall St has no position in any stocks mentioned.
About SZSE:002072
Flawless balance sheet and fair value.
