- China
- /
- Construction
- /
- SZSE:002060
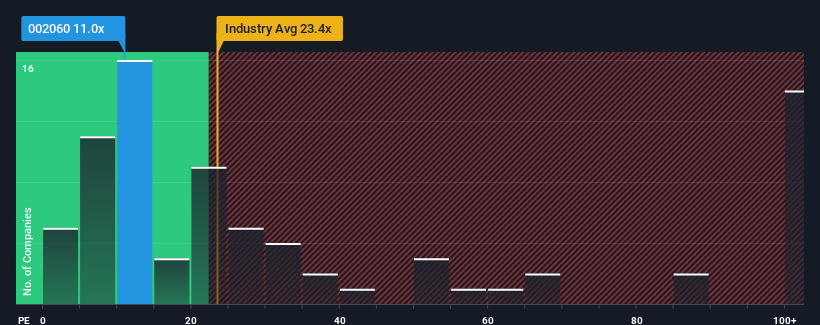
Market Cool On Guangdong Construction Engineering Group Co., Ltd.'s (SZSE:002060) Earnings


Guangdong Construction Engineering Group Co., Ltd.'s (SZSE:002060) price-to-earnings (or "P/E") ratio of 11x might make it look like a strong buy right now compared to the market in China, where around half of the companies have P/E ratios above 40x and even P/E's above 78x are quite common. Although, it's not wise to just take the P/E at face value as there may be an explanation why it's so limited.
With earnings that are retreating more than the market's of late, Guangdong Construction Engineering Group has been very sluggish. It seems that many are expecting the dismal earnings performance to persist, which has repressed the P/E. If you still like the company, you'd want its earnings trajectory to turn around before making any decisions. If not, then existing shareholders will probably struggle to get excited about the future direction of the share price.
Check out our latest analysis for Guangdong Construction Engineering Group
What Are Growth Metrics Telling Us About The Low P/E?
The only time you'd be truly comfortable seeing a P/E as depressed as Guangdong Construction Engineering Group's is when the company's growth is on track to lag the market decidedly.
If we review the last year of earnings, dishearteningly the company's profits fell to the tune of 33%. Regardless, EPS has managed to lift by a handy 23% in aggregate from three years ago, thanks to the earlier period of growth. Although it's been a bumpy ride, it's still fair to say the earnings growth recently has been mostly respectable for the company.
Shifting to the future, estimates from the one analyst covering the company suggest earnings should grow by 37% over the next year. That's shaping up to be similar to the 37% growth forecast for the broader market.
In light of this, it's peculiar that Guangdong Construction Engineering Group's P/E sits below the majority of other companies. It may be that most investors are not convinced the company can achieve future growth expectations.
The Final Word
Typically, we'd caution against reading too much into price-to-earnings ratios when settling on investment decisions, though it can reveal plenty about what other market participants think about the company.
Our examination of Guangdong Construction Engineering Group's analyst forecasts revealed that its market-matching earnings outlook isn't contributing to its P/E as much as we would have predicted. There could be some unobserved threats to earnings preventing the P/E ratio from matching the outlook. At least the risk of a price drop looks to be subdued, but investors seem to think future earnings could see some volatility.
You need to take note of risks, for example - Guangdong Construction Engineering Group has 2 warning signs (and 1 which can't be ignored) we think you should know about.
You might be able to find a better investment than Guangdong Construction Engineering Group. If you want a selection of possible candidates, check out this free list of interesting companies that trade on a low P/E (but have proven they can grow earnings).
If you're looking to trade Guangdong Construction Engineering Group, open an account with the lowest-cost platform trusted by professionals, Interactive Brokers.
With clients in over 200 countries and territories, and access to 160 markets, IBKR lets you trade stocks, options, futures, forex, bonds and funds from a single integrated account.
Enjoy no hidden fees, no account minimums, and FX conversion rates as low as 0.03%, far better than what most brokers offer.
Sponsored ContentNew: Manage All Your Stock Portfolios in One Place
We've created the ultimate portfolio companion for stock investors, and it's free.
• Connect an unlimited number of Portfolios and see your total in one currency
• Be alerted to new Warning Signs or Risks via email or mobile
• Track the Fair Value of your stocks
Have feedback on this article? Concerned about the content? Get in touch with us directly. Alternatively, email editorial-team (at) simplywallst.com.
This article by Simply Wall St is general in nature. We provide commentary based on historical data and analyst forecasts only using an unbiased methodology and our articles are not intended to be financial advice. It does not constitute a recommendation to buy or sell any stock, and does not take account of your objectives, or your financial situation. We aim to bring you long-term focused analysis driven by fundamental data. Note that our analysis may not factor in the latest price-sensitive company announcements or qualitative material. Simply Wall St has no position in any stocks mentioned.
About SZSE:002060
Guangdong Construction Engineering Group
Guangdong Construction Engineering Group Co., Ltd.
Established dividend payer with adequate balance sheet.
