
Advertisement
- China
- /
- Trade Distributors
- /
- SZSE:000632
Market Might Still Lack Some Conviction On Fujian Sanmu Group Co., Ltd. (SZSE:000632) Even After 28% Share Price Boost

Fujian Sanmu Group Co., Ltd. (SZSE:000632) shareholders are no doubt pleased to see that the share price has bounced 28% in the last month, although it is still struggling to make up recently lost ground. Unfortunately, the gains of the last month did little to right the losses of the last year with the stock still down 23% over that time.
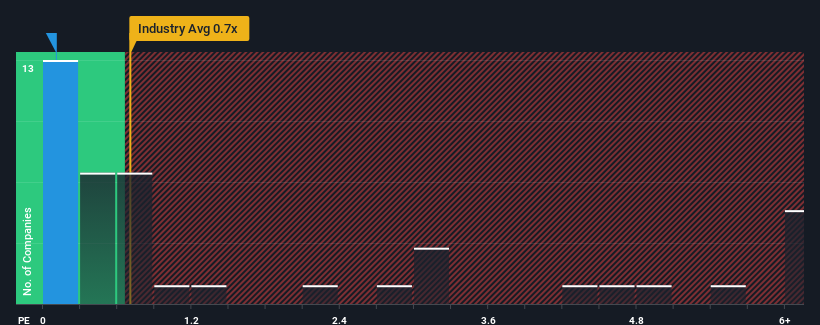
Even after such a large jump in price, Fujian Sanmu Group may still be sending bullish signals at the moment with its price-to-sales (or "P/S") ratio of 0.1x, since almost half of all companies in the Trade Distributors industry in China have P/S ratios greater than 0.7x and even P/S higher than 3x are not unusual. However, the P/S might be low for a reason and it requires further investigation to determine if it's justified.
Check out our latest analysis for Fujian Sanmu Group
How Fujian Sanmu Group Has Been Performing
With revenue growth that's exceedingly strong of late, Fujian Sanmu Group has been doing very well. One possibility is that the P/S ratio is low because investors think this strong revenue growth might actually underperform the broader industry in the near future. If you like the company, you'd be hoping this isn't the case so that you could potentially pick up some stock while it's out of favour.
Although there are no analyst estimates available for Fujian Sanmu Group, take a look at this free data-rich visualisation to see how the company stacks up on earnings, revenue and cash flow.Do Revenue Forecasts Match The Low P/S Ratio?
In order to justify its P/S ratio, Fujian Sanmu Group would need to produce sluggish growth that's trailing the industry.
If we review the last year of revenue growth, the company posted a terrific increase of 33%. Pleasingly, revenue has also lifted 135% in aggregate from three years ago, thanks to the last 12 months of growth. So we can start by confirming that the company has done a great job of growing revenue over that time.
This is in contrast to the rest of the industry, which is expected to grow by 17% over the next year, materially lower than the company's recent medium-term annualised growth rates.
With this in mind, we find it intriguing that Fujian Sanmu Group's P/S isn't as high compared to that of its industry peers. Apparently some shareholders believe the recent performance has exceeded its limits and have been accepting significantly lower selling prices.
The Key Takeaway
Fujian Sanmu Group's stock price has surged recently, but its but its P/S still remains modest. It's argued the price-to-sales ratio is an inferior measure of value within certain industries, but it can be a powerful business sentiment indicator.
We're very surprised to see Fujian Sanmu Group currently trading on a much lower than expected P/S since its recent three-year growth is higher than the wider industry forecast. Potential investors that are sceptical over continued revenue performance may be preventing the P/S ratio from matching previous strong performance. It appears many are indeed anticipating revenue instability, because the persistence of these recent medium-term conditions would normally provide a boost to the share price.
We don't want to rain on the parade too much, but we did also find 4 warning signs for Fujian Sanmu Group (2 are significant!) that you need to be mindful of.
If companies with solid past earnings growth is up your alley, you may wish to see this free collection of other companies with strong earnings growth and low P/E ratios.
New: AI Stock Screener & Alerts
Our new AI Stock Screener scans the market every day to uncover opportunities.
• Dividend Powerhouses (3%+ Yield)
• Undervalued Small Caps with Insider Buying
• High growth Tech and AI Companies
Or build your own from over 50 metrics.
Have feedback on this article? Concerned about the content? Get in touch with us directly. Alternatively, email editorial-team (at) simplywallst.com.
This article by Simply Wall St is general in nature. We provide commentary based on historical data and analyst forecasts only using an unbiased methodology and our articles are not intended to be financial advice. It does not constitute a recommendation to buy or sell any stock, and does not take account of your objectives, or your financial situation. We aim to bring you long-term focused analysis driven by fundamental data. Note that our analysis may not factor in the latest price-sensitive company announcements or qualitative material. Simply Wall St has no position in any stocks mentioned.
About SZSE:000632
Fujian Sanmu Group
Engages in the import and export trading business in China.
Mediocre balance sheet and slightly overvalued.
Market Insights

Advertisement
Community Narratives
Groundbreaking therapies that could change the treatment landscape for PTSD, fibromyalgia, MS & Alzheimer’s
Fair Value US$6.20|86.9% undervalued
CM
Community Contributor
DigitalOcean Will Grow 14% by Embracing AI with Paperspace Acquisition
Fair Value US$50.00|40.2% undervalued
NE
Community Contributor
Viant Technology: A Rising AdTech Challenger in the AI-Powered CTV Market
Fair Value US$38.61|62.7% undervalued
BL
Community Contributor
Volvo will Accelerate Forward into Electric and Autonomous Leadership in Five Years
Fair Value SEK 438.80|39.7% undervalued
UN
Community Contributor