Are China International Marine Containers (Group) Co., Ltd. (SZSE:000039) Investors Paying Above The Intrinsic Value?


Key Insights
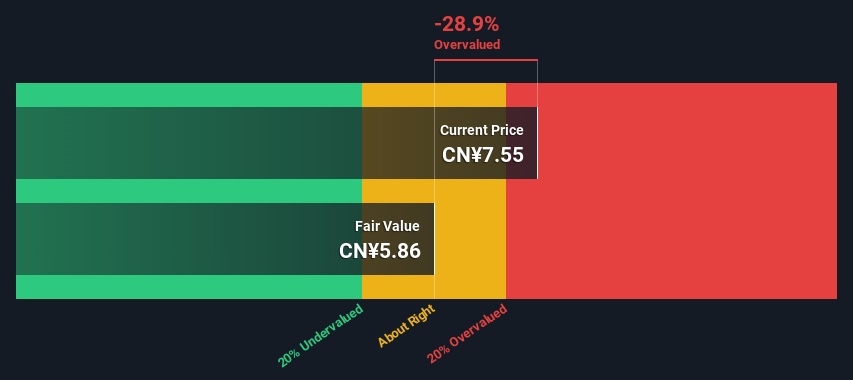
- The projected fair value for China International Marine Containers (Group) is CN¥5.86 based on 2 Stage Free Cash Flow to Equity
- China International Marine Containers (Group) is estimated to be 29% overvalued based on current share price of CN¥7.55
- Analyst price target for 000039 is CN¥10.19, which is 74% above our fair value estimate
Does the August share price for China International Marine Containers (Group) Co., Ltd. (SZSE:000039) reflect what it's really worth? Today, we will estimate the stock's intrinsic value by estimating the company's future cash flows and discounting them to their present value. We will use the Discounted Cash Flow (DCF) model on this occasion. It may sound complicated, but actually it is quite simple!
We would caution that there are many ways of valuing a company and, like the DCF, each technique has advantages and disadvantages in certain scenarios. If you want to learn more about discounted cash flow, the rationale behind this calculation can be read in detail in the Simply Wall St analysis model.
See our latest analysis for China International Marine Containers (Group)
The Model
We're using the 2-stage growth model, which simply means we take in account two stages of company's growth. In the initial period the company may have a higher growth rate and the second stage is usually assumed to have a stable growth rate. To start off with, we need to estimate the next ten years of cash flows. Where possible we use analyst estimates, but when these aren't available we extrapolate the previous free cash flow (FCF) from the last estimate or reported value. We assume companies with shrinking free cash flow will slow their rate of shrinkage, and that companies with growing free cash flow will see their growth rate slow, over this period. We do this to reflect that growth tends to slow more in the early years than it does in later years.
Generally we assume that a dollar today is more valuable than a dollar in the future, and so the sum of these future cash flows is then discounted to today's value:
10-year free cash flow (FCF) forecast
| 2025 | 2026 | 2027 | 2028 | 2029 | 2030 | 2031 | 2032 | 2033 | 2034 | |
| Levered FCF (CN¥, Millions) | CN¥5.96b | CN¥4.31b | CN¥3.46b | CN¥3.01b | CN¥2.76b | CN¥2.63b | CN¥2.56b | CN¥2.53b | CN¥2.54b | CN¥2.56b |
| Growth Rate Estimate Source | Analyst x1 | Analyst x1 | Est @ -19.79% | Est @ -13.00% | Est @ -8.24% | Est @ -4.92% | Est @ -2.59% | Est @ -0.96% | Est @ 0.19% | Est @ 0.99% |
| Present Value (CN¥, Millions) Discounted @ 11% | CN¥5.4k | CN¥3.5k | CN¥2.5k | CN¥2.0k | CN¥1.6k | CN¥1.4k | CN¥1.2k | CN¥1.1k | CN¥977 | CN¥887 |
("Est" = FCF growth rate estimated by Simply Wall St)
Present Value of 10-year Cash Flow (PVCF) = CN¥21b
After calculating the present value of future cash flows in the initial 10-year period, we need to calculate the Terminal Value, which accounts for all future cash flows beyond the first stage. The Gordon Growth formula is used to calculate Terminal Value at a future annual growth rate equal to the 5-year average of the 10-year government bond yield of 2.9%. We discount the terminal cash flows to today's value at a cost of equity of 11%.
Terminal Value (TV)= FCF2034 × (1 + g) ÷ (r – g) = CN¥2.6b× (1 + 2.9%) ÷ (11%– 2.9%) = CN¥32b
Present Value of Terminal Value (PVTV)= TV / (1 + r)10= CN¥32b÷ ( 1 + 11%)10= CN¥11b
The total value is the sum of cash flows for the next ten years plus the discounted terminal value, which results in the Total Equity Value, which in this case is CN¥31b. In the final step we divide the equity value by the number of shares outstanding. Relative to the current share price of CN¥7.6, the company appears slightly overvalued at the time of writing. The assumptions in any calculation have a big impact on the valuation, so it is better to view this as a rough estimate, not precise down to the last cent.
Important Assumptions
We would point out that the most important inputs to a discounted cash flow are the discount rate and of course the actual cash flows. You don't have to agree with these inputs, I recommend redoing the calculations yourself and playing with them. The DCF also does not consider the possible cyclicality of an industry, or a company's future capital requirements, so it does not give a full picture of a company's potential performance. Given that we are looking at China International Marine Containers (Group) as potential shareholders, the cost of equity is used as the discount rate, rather than the cost of capital (or weighted average cost of capital, WACC) which accounts for debt. In this calculation we've used 11%, which is based on a levered beta of 1.675. Beta is a measure of a stock's volatility, compared to the market as a whole. We get our beta from the industry average beta of globally comparable companies, with an imposed limit between 0.8 and 2.0, which is a reasonable range for a stable business.
SWOT Analysis for China International Marine Containers (Group)
- Net debt to equity ratio below 40%.
- Earnings declined over the past year.
- Interest payments on debt are not well covered.
- Dividend is low compared to the top 25% of dividend payers in the Machinery market.
- Expensive based on P/E ratio and estimated fair value.
- Annual earnings are forecast to grow faster than the Chinese market.
- Debt is not well covered by operating cash flow.
- Annual revenue is forecast to grow slower than the Chinese market.
Looking Ahead:
Whilst important, the DCF calculation ideally won't be the sole piece of analysis you scrutinize for a company. It's not possible to obtain a foolproof valuation with a DCF model. Preferably you'd apply different cases and assumptions and see how they would impact the company's valuation. For instance, if the terminal value growth rate is adjusted slightly, it can dramatically alter the overall result. Why is the intrinsic value lower than the current share price? For China International Marine Containers (Group), we've put together three pertinent elements you should further examine:
- Risks: Take risks, for example - China International Marine Containers (Group) has 1 warning sign we think you should be aware of.
- Future Earnings: How does 000039's growth rate compare to its peers and the wider market? Dig deeper into the analyst consensus number for the upcoming years by interacting with our free analyst growth expectation chart.
- Other High Quality Alternatives: Do you like a good all-rounder? Explore our interactive list of high quality stocks to get an idea of what else is out there you may be missing!
PS. The Simply Wall St app conducts a discounted cash flow valuation for every stock on the SZSE every day. If you want to find the calculation for other stocks just search here.
New: AI Stock Screener & Alerts
Our new AI Stock Screener scans the market every day to uncover opportunities.
• Dividend Powerhouses (3%+ Yield)
• Undervalued Small Caps with Insider Buying
• High growth Tech and AI Companies
Or build your own from over 50 metrics.
Have feedback on this article? Concerned about the content? Get in touch with us directly. Alternatively, email editorial-team (at) simplywallst.com.
This article by Simply Wall St is general in nature. We provide commentary based on historical data and analyst forecasts only using an unbiased methodology and our articles are not intended to be financial advice. It does not constitute a recommendation to buy or sell any stock, and does not take account of your objectives, or your financial situation. We aim to bring you long-term focused analysis driven by fundamental data. Note that our analysis may not factor in the latest price-sensitive company announcements or qualitative material. Simply Wall St has no position in any stocks mentioned.
About SZSE:000039
China International Marine Containers (Group)
Manufactures and sells logistics and energy equipment in China, America, Europe, rest of Asia, and internationally.
Excellent balance sheet with moderate growth potential.
Similar Companies
Market Insights

Community Narratives
