Fujian Supertch Advanced MaterialLtd (SHSE:688398) Will Want To Turn Around Its Return Trends


If you're looking for a multi-bagger, there's a few things to keep an eye out for. In a perfect world, we'd like to see a company investing more capital into its business and ideally the returns earned from that capital are also increasing. This shows us that it's a compounding machine, able to continually reinvest its earnings back into the business and generate higher returns. Although, when we looked at Fujian Supertch Advanced MaterialLtd (SHSE:688398), it didn't seem to tick all of these boxes.
What Is Return On Capital Employed (ROCE)?
For those who don't know, ROCE is a measure of a company's yearly pre-tax profit (its return), relative to the capital employed in the business. Analysts use this formula to calculate it for Fujian Supertch Advanced MaterialLtd:
Return on Capital Employed = Earnings Before Interest and Tax (EBIT) ÷ (Total Assets - Current Liabilities)
0.088 = CN¥146m ÷ (CN¥2.0b - CN¥315m) (Based on the trailing twelve months to June 2024).
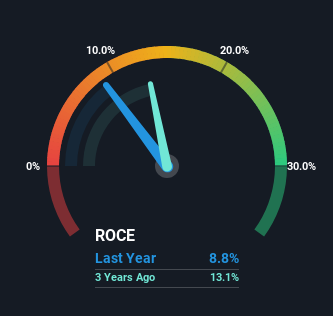
Thus, Fujian Supertch Advanced MaterialLtd has an ROCE of 8.8%. On its own that's a low return, but compared to the average of 5.5% generated by the Machinery industry, it's much better.
View our latest analysis for Fujian Supertch Advanced MaterialLtd
Above you can see how the current ROCE for Fujian Supertch Advanced MaterialLtd compares to its prior returns on capital, but there's only so much you can tell from the past. If you're interested, you can view the analysts predictions in our free analyst report for Fujian Supertch Advanced MaterialLtd .
What Does the ROCE Trend For Fujian Supertch Advanced MaterialLtd Tell Us?
When we looked at the ROCE trend at Fujian Supertch Advanced MaterialLtd, we didn't gain much confidence. Over the last five years, returns on capital have decreased to 8.8% from 19% five years ago. Although, given both revenue and the amount of assets employed in the business have increased, it could suggest the company is investing in growth, and the extra capital has led to a short-term reduction in ROCE. And if the increased capital generates additional returns, the business, and thus shareholders, will benefit in the long run.
On a related note, Fujian Supertch Advanced MaterialLtd has decreased its current liabilities to 16% of total assets. That could partly explain why the ROCE has dropped. What's more, this can reduce some aspects of risk to the business because now the company's suppliers or short-term creditors are funding less of its operations. Since the business is basically funding more of its operations with it's own money, you could argue this has made the business less efficient at generating ROCE.
What We Can Learn From Fujian Supertch Advanced MaterialLtd's ROCE
While returns have fallen for Fujian Supertch Advanced MaterialLtd in recent times, we're encouraged to see that sales are growing and that the business is reinvesting in its operations. And there could be an opportunity here if other metrics look good too, because the stock has declined 27% in the last three years. So we think it'd be worthwhile to look further into this stock given the trends look encouraging.
Fujian Supertch Advanced MaterialLtd does come with some risks though, we found 2 warning signs in our investment analysis, and 1 of those is a bit concerning...
For those who like to invest in solid companies, check out this free list of companies with solid balance sheets and high returns on equity.
If you're looking to trade Fujian Supertch Advanced MaterialLtd, open an account with the lowest-cost platform trusted by professionals, Interactive Brokers.
With clients in over 200 countries and territories, and access to 160 markets, IBKR lets you trade stocks, options, futures, forex, bonds and funds from a single integrated account.
Enjoy no hidden fees, no account minimums, and FX conversion rates as low as 0.03%, far better than what most brokers offer.
Sponsored ContentNew: AI Stock Screener & Alerts
Our new AI Stock Screener scans the market every day to uncover opportunities.
• Dividend Powerhouses (3%+ Yield)
• Undervalued Small Caps with Insider Buying
• High growth Tech and AI Companies
Or build your own from over 50 metrics.
Have feedback on this article? Concerned about the content? Get in touch with us directly. Alternatively, email editorial-team (at) simplywallst.com.
This article by Simply Wall St is general in nature. We provide commentary based on historical data and analyst forecasts only using an unbiased methodology and our articles are not intended to be financial advice. It does not constitute a recommendation to buy or sell any stock, and does not take account of your objectives, or your financial situation. We aim to bring you long-term focused analysis driven by fundamental data. Note that our analysis may not factor in the latest price-sensitive company announcements or qualitative material. Simply Wall St has no position in any stocks mentioned.
About SHSE:688398
Fujian Supertch Advanced MaterialLtd
Fujian Supertch Advanced Material CO.,Ltd.
Adequate balance sheet with moderate growth potential.
Market Insights

Community Narratives

