
Advertisement
Be Wary Of Leader Harmonious Drive Systems (SHSE:688017) And Its Returns On Capital
If you're not sure where to start when looking for the next multi-bagger, there are a few key trends you should keep an eye out for. Firstly, we'd want to identify a growing return on capital employed (ROCE) and then alongside that, an ever-increasing base of capital employed. Put simply, these types of businesses are compounding machines, meaning they are continually reinvesting their earnings at ever-higher rates of return. In light of that, when we looked at Leader Harmonious Drive Systems (SHSE:688017) and its ROCE trend, we weren't exactly thrilled.
Understanding Return On Capital Employed (ROCE)
If you haven't worked with ROCE before, it measures the 'return' (pre-tax profit) a company generates from capital employed in its business. To calculate this metric for Leader Harmonious Drive Systems, this is the formula:
Return on Capital Employed = Earnings Before Interest and Tax (EBIT) ÷ (Total Assets - Current Liabilities)
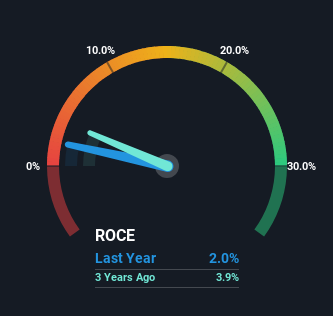
0.02 = CN¥45m ÷ (CN¥2.9b - CN¥652m) (Based on the trailing twelve months to March 2024).
Therefore, Leader Harmonious Drive Systems has an ROCE of 2.0%. Ultimately, that's a low return and it under-performs the Machinery industry average of 5.6%.
Check out our latest analysis for Leader Harmonious Drive Systems
Above you can see how the current ROCE for Leader Harmonious Drive Systems compares to its prior returns on capital, but there's only so much you can tell from the past. If you're interested, you can view the analysts predictions in our free analyst report for Leader Harmonious Drive Systems .
What Can We Tell From Leader Harmonious Drive Systems' ROCE Trend?
On the surface, the trend of ROCE at Leader Harmonious Drive Systems doesn't inspire confidence. Over the last five years, returns on capital have decreased to 2.0% from 9.1% five years ago. Given the business is employing more capital while revenue has slipped, this is a bit concerning. If this were to continue, you might be looking at a company that is trying to reinvest for growth but is actually losing market share since sales haven't increased.
On a side note, Leader Harmonious Drive Systems' current liabilities have increased over the last five years to 23% of total assets, effectively distorting the ROCE to some degree. If current liabilities hadn't increased as much as they did, the ROCE could actually be even lower. Keep an eye on this ratio, because the business could encounter some new risks if this metric gets too high.
The Key Takeaway
In summary, we're somewhat concerned by Leader Harmonious Drive Systems' diminishing returns on increasing amounts of capital. Yet despite these concerning fundamentals, the stock has performed strongly with a 23% return over the last three years, so investors appear very optimistic. In any case, the current underlying trends don't bode well for long term performance so unless they reverse, we'd start looking elsewhere.
On a final note, we've found 1 warning sign for Leader Harmonious Drive Systems that we think you should be aware of.
While Leader Harmonious Drive Systems isn't earning the highest return, check out this free list of companies that are earning high returns on equity with solid balance sheets.
New: AI Stock Screener & Alerts
Our new AI Stock Screener scans the market every day to uncover opportunities.
• Dividend Powerhouses (3%+ Yield)
• Undervalued Small Caps with Insider Buying
• High growth Tech and AI Companies
Or build your own from over 50 metrics.
Have feedback on this article? Concerned about the content? Get in touch with us directly. Alternatively, email editorial-team (at) simplywallst.com.
This article by Simply Wall St is general in nature. We provide commentary based on historical data and analyst forecasts only using an unbiased methodology and our articles are not intended to be financial advice. It does not constitute a recommendation to buy or sell any stock, and does not take account of your objectives, or your financial situation. We aim to bring you long-term focused analysis driven by fundamental data. Note that our analysis may not factor in the latest price-sensitive company announcements or qualitative material. Simply Wall St has no position in any stocks mentioned.
About SHSE:688017
Leader Harmonious Drive Systems
Leader Harmonious Drive Systems Co., Ltd.
High growth potential with excellent balance sheet.
Market Insights

Advertisement
Community Narratives
The Next Phase of Energy Storage: How NeoVolta Is Tackling America’s Power Crunch
Fair Value US$7.50|35.1% undervalued
MA
Community Contributor
Why EnSilica is Worth Possibly 13x its Current Price
Fair Value UK£5.00|89.8% undervalued
DO
Community Contributor
M&A Activity, Industry Diversification & A Defense Contract Monopoly Will Push BWXT For Healthy Long-Term Growth
Fair Value US$220.00|15.2% undervalued
CL
Community Contributor
A case for Cassiar Gold Corp (TSXV: GLDC) to reach CAD$8-10 before 2030 (X30-37)
Fair Value CA$10.00|96.0% undervalued
AG
Community Contributor