Suzhou Kelida Building& Decoration Co.,Ltd. (SHSE:603828) Held Back By Insufficient Growth Even After Shares Climb 38%


Suzhou Kelida Building& Decoration Co.,Ltd. (SHSE:603828) shareholders have had their patience rewarded with a 38% share price jump in the last month. Not all shareholders will be feeling jubilant, since the share price is still down a very disappointing 35% in the last twelve months.
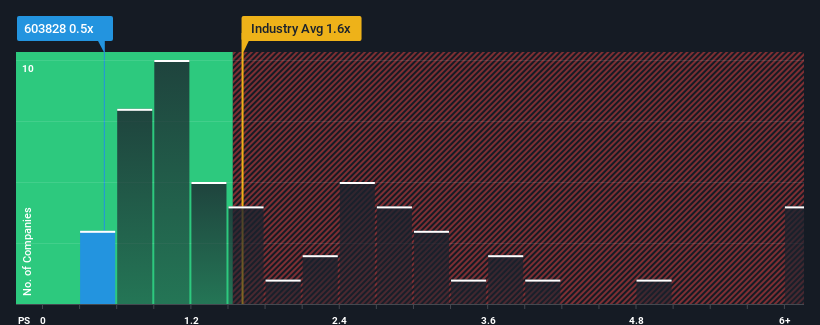
Although its price has surged higher, it would still be understandable if you think Suzhou Kelida Building& DecorationLtd is a stock with good investment prospects with a price-to-sales ratios (or "P/S") of 0.5x, considering almost half the companies in China's Building industry have P/S ratios above 1.6x. Although, it's not wise to just take the P/S at face value as there may be an explanation why it's limited.
Check out our latest analysis for Suzhou Kelida Building& DecorationLtd
What Does Suzhou Kelida Building& DecorationLtd's P/S Mean For Shareholders?
Suzhou Kelida Building& DecorationLtd certainly has been doing a great job lately as it's been growing its revenue at a really rapid pace. It might be that many expect the strong revenue performance to degrade substantially, which has repressed the P/S ratio. If that doesn't eventuate, then existing shareholders have reason to be quite optimistic about the future direction of the share price.
We don't have analyst forecasts, but you can see how recent trends are setting up the company for the future by checking out our free report on Suzhou Kelida Building& DecorationLtd's earnings, revenue and cash flow.Is There Any Revenue Growth Forecasted For Suzhou Kelida Building& DecorationLtd?
In order to justify its P/S ratio, Suzhou Kelida Building& DecorationLtd would need to produce sluggish growth that's trailing the industry.
Retrospectively, the last year delivered an exceptional 30% gain to the company's top line. Despite this strong recent growth, it's still struggling to catch up as its three-year revenue frustratingly shrank by 4.5% overall. Accordingly, shareholders would have felt downbeat about the medium-term rates of revenue growth.
Comparing that to the industry, which is predicted to deliver 21% growth in the next 12 months, the company's downward momentum based on recent medium-term revenue results is a sobering picture.
With this information, we are not surprised that Suzhou Kelida Building& DecorationLtd is trading at a P/S lower than the industry. Nonetheless, there's no guarantee the P/S has reached a floor yet with revenue going in reverse. There's potential for the P/S to fall to even lower levels if the company doesn't improve its top-line growth.
The Bottom Line On Suzhou Kelida Building& DecorationLtd's P/S
The latest share price surge wasn't enough to lift Suzhou Kelida Building& DecorationLtd's P/S close to the industry median. It's argued the price-to-sales ratio is an inferior measure of value within certain industries, but it can be a powerful business sentiment indicator.
As we suspected, our examination of Suzhou Kelida Building& DecorationLtd revealed its shrinking revenue over the medium-term is contributing to its low P/S, given the industry is set to grow. Right now shareholders are accepting the low P/S as they concede future revenue probably won't provide any pleasant surprises either. Unless the recent medium-term conditions improve, they will continue to form a barrier for the share price around these levels.
Plus, you should also learn about this 1 warning sign we've spotted with Suzhou Kelida Building& DecorationLtd.
If these risks are making you reconsider your opinion on Suzhou Kelida Building& DecorationLtd, explore our interactive list of high quality stocks to get an idea of what else is out there.
If you're looking to trade Suzhou Kelida Building& DecorationLtd, open an account with the lowest-cost platform trusted by professionals, Interactive Brokers.
With clients in over 200 countries and territories, and access to 160 markets, IBKR lets you trade stocks, options, futures, forex, bonds and funds from a single integrated account.
Enjoy no hidden fees, no account minimums, and FX conversion rates as low as 0.03%, far better than what most brokers offer.
Sponsored ContentNew: Manage All Your Stock Portfolios in One Place
We've created the ultimate portfolio companion for stock investors, and it's free.
• Connect an unlimited number of Portfolios and see your total in one currency
• Be alerted to new Warning Signs or Risks via email or mobile
• Track the Fair Value of your stocks
Have feedback on this article? Concerned about the content? Get in touch with us directly. Alternatively, email editorial-team (at) simplywallst.com.
This article by Simply Wall St is general in nature. We provide commentary based on historical data and analyst forecasts only using an unbiased methodology and our articles are not intended to be financial advice. It does not constitute a recommendation to buy or sell any stock, and does not take account of your objectives, or your financial situation. We aim to bring you long-term focused analysis driven by fundamental data. Note that our analysis may not factor in the latest price-sensitive company announcements or qualitative material. Simply Wall St has no position in any stocks mentioned.
About SHSE:603828
Suzhou Kelida Building& DecorationLtd
Suzhou Kelida Building& Decoration Co.,Ltd.
Good value with mediocre balance sheet.
Market Insights

Community Narratives


