- China
- /
- Aerospace & Defense
- /
- SHSE:601606
Anhui Great Wall Military Industry (SHSE:601606) Is Making Moderate Use Of Debt


The external fund manager backed by Berkshire Hathaway's Charlie Munger, Li Lu, makes no bones about it when he says 'The biggest investment risk is not the volatility of prices, but whether you will suffer a permanent loss of capital.' So it might be obvious that you need to consider debt, when you think about how risky any given stock is, because too much debt can sink a company. We note that Anhui Great Wall Military Industry Co., Ltd. (SHSE:601606) does have debt on its balance sheet. But the real question is whether this debt is making the company risky.
When Is Debt A Problem?
Debt is a tool to help businesses grow, but if a business is incapable of paying off its lenders, then it exists at their mercy. Part and parcel of capitalism is the process of 'creative destruction' where failed businesses are mercilessly liquidated by their bankers. However, a more frequent (but still costly) occurrence is where a company must issue shares at bargain-basement prices, permanently diluting shareholders, just to shore up its balance sheet. Of course, plenty of companies use debt to fund growth, without any negative consequences. When we think about a company's use of debt, we first look at cash and debt together.
Check out our latest analysis for Anhui Great Wall Military Industry
What Is Anhui Great Wall Military Industry's Net Debt?
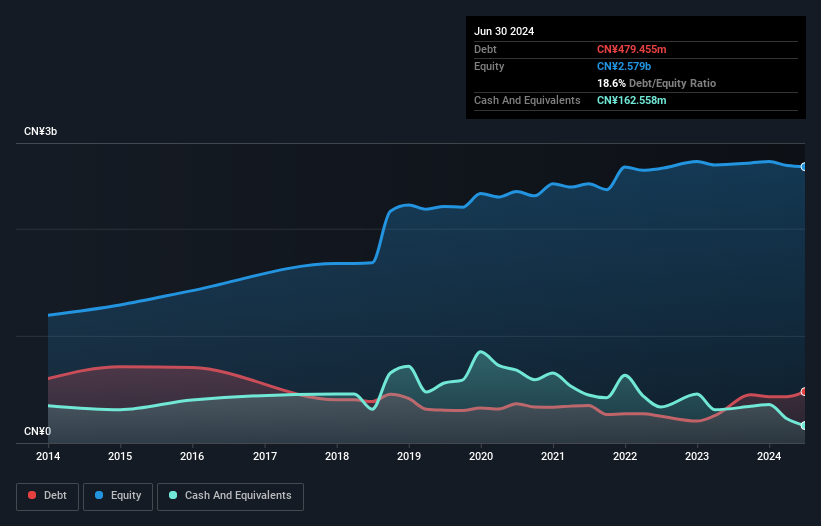
The image below, which you can click on for greater detail, shows that at June 2024 Anhui Great Wall Military Industry had debt of CN¥479.5m, up from CN¥450.0m in one year. However, it also had CN¥162.6m in cash, and so its net debt is CN¥316.9m.
A Look At Anhui Great Wall Military Industry's Liabilities
We can see from the most recent balance sheet that Anhui Great Wall Military Industry had liabilities of CN¥1.48b falling due within a year, and liabilities of CN¥429.3m due beyond that. Offsetting these obligations, it had cash of CN¥162.6m as well as receivables valued at CN¥1.81b due within 12 months. So it actually has CN¥64.5m more liquid assets than total liabilities.
Having regard to Anhui Great Wall Military Industry's size, it seems that its liquid assets are well balanced with its total liabilities. So it's very unlikely that the CN¥6.82b company is short on cash, but still worth keeping an eye on the balance sheet. The balance sheet is clearly the area to focus on when you are analysing debt. But you can't view debt in total isolation; since Anhui Great Wall Military Industry will need earnings to service that debt. So if you're keen to discover more about its earnings, it might be worth checking out this graph of its long term earnings trend.
Over 12 months, Anhui Great Wall Military Industry made a loss at the EBIT level, and saw its revenue drop to CN¥1.5b, which is a fall of 5.2%. That's not what we would hope to see.
Caveat Emptor
Importantly, Anhui Great Wall Military Industry had an earnings before interest and tax (EBIT) loss over the last year. Indeed, it lost CN¥33m at the EBIT level. On a more positive note, the company does have liquid assets, so it has a bit of time to improve its operations before the debt becomes an acute problem. Still, we'd be more encouraged to study the business in depth if it already had some free cash flow. This one is a bit too risky for our liking. When analysing debt levels, the balance sheet is the obvious place to start. However, not all investment risk resides within the balance sheet - far from it. To that end, you should be aware of the 1 warning sign we've spotted with Anhui Great Wall Military Industry .
If you're interested in investing in businesses that can grow profits without the burden of debt, then check out this free list of growing businesses that have net cash on the balance sheet.
If you're looking to trade Anhui Great Wall Military Industry, open an account with the lowest-cost platform trusted by professionals, Interactive Brokers.
With clients in over 200 countries and territories, and access to 160 markets, IBKR lets you trade stocks, options, futures, forex, bonds and funds from a single integrated account.
Enjoy no hidden fees, no account minimums, and FX conversion rates as low as 0.03%, far better than what most brokers offer.
Sponsored ContentNew: Manage All Your Stock Portfolios in One Place
We've created the ultimate portfolio companion for stock investors, and it's free.
• Connect an unlimited number of Portfolios and see your total in one currency
• Be alerted to new Warning Signs or Risks via email or mobile
• Track the Fair Value of your stocks
Have feedback on this article? Concerned about the content? Get in touch with us directly. Alternatively, email editorial-team (at) simplywallst.com.
This article by Simply Wall St is general in nature. We provide commentary based on historical data and analyst forecasts only using an unbiased methodology and our articles are not intended to be financial advice. It does not constitute a recommendation to buy or sell any stock, and does not take account of your objectives, or your financial situation. We aim to bring you long-term focused analysis driven by fundamental data. Note that our analysis may not factor in the latest price-sensitive company announcements or qualitative material. Simply Wall St has no position in any stocks mentioned.
About SHSE:601606
Anhui Great Wall Military Industry
Anhui Great Wall Military Industry Co., Ltd.
Mediocre balance sheet and slightly overvalued.

