Keda Industrial Group (SHSE:600499) Is Experiencing Growth In Returns On Capital


Did you know there are some financial metrics that can provide clues of a potential multi-bagger? Firstly, we'd want to identify a growing return on capital employed (ROCE) and then alongside that, an ever-increasing base of capital employed. This shows us that it's a compounding machine, able to continually reinvest its earnings back into the business and generate higher returns. So when we looked at Keda Industrial Group (SHSE:600499) and its trend of ROCE, we really liked what we saw.
What Is Return On Capital Employed (ROCE)?
For those who don't know, ROCE is a measure of a company's yearly pre-tax profit (its return), relative to the capital employed in the business. To calculate this metric for Keda Industrial Group, this is the formula:
Return on Capital Employed = Earnings Before Interest and Tax (EBIT) ÷ (Total Assets - Current Liabilities)
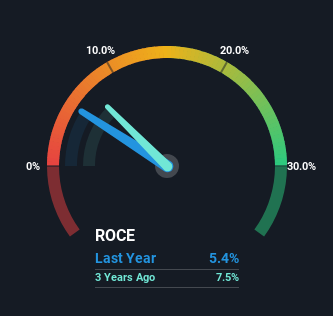
0.054 = CN¥929m ÷ (CN¥25b - CN¥7.8b) (Based on the trailing twelve months to June 2024).
Therefore, Keda Industrial Group has an ROCE of 5.4%. On its own that's a low return on capital but it's in line with the industry's average returns of 5.5%.
Check out our latest analysis for Keda Industrial Group
In the above chart we have measured Keda Industrial Group's prior ROCE against its prior performance, but the future is arguably more important. If you'd like to see what analysts are forecasting going forward, you should check out our free analyst report for Keda Industrial Group .
What Can We Tell From Keda Industrial Group's ROCE Trend?
While in absolute terms it isn't a high ROCE, it's promising to see that it has been moving in the right direction. Over the last five years, returns on capital employed have risen substantially to 5.4%. Basically the business is earning more per dollar of capital invested and in addition to that, 161% more capital is being employed now too. This can indicate that there's plenty of opportunities to invest capital internally and at ever higher rates, a combination that's common among multi-baggers.
In another part of our analysis, we noticed that the company's ratio of current liabilities to total assets decreased to 31%, which broadly means the business is relying less on its suppliers or short-term creditors to fund its operations. So this improvement in ROCE has come from the business' underlying economics, which is great to see.
In Conclusion...
In summary, it's great to see that Keda Industrial Group can compound returns by consistently reinvesting capital at increasing rates of return, because these are some of the key ingredients of those highly sought after multi-baggers. And investors seem to expect more of this going forward, since the stock has rewarded shareholders with a 91% return over the last five years. Therefore, we think it would be worth your time to check if these trends are going to continue.
One more thing, we've spotted 3 warning signs facing Keda Industrial Group that you might find interesting.
If you want to search for solid companies with great earnings, check out this free list of companies with good balance sheets and impressive returns on equity.
If you're looking to trade Keda Industrial Group, open an account with the lowest-cost platform trusted by professionals, Interactive Brokers.
With clients in over 200 countries and territories, and access to 160 markets, IBKR lets you trade stocks, options, futures, forex, bonds and funds from a single integrated account.
Enjoy no hidden fees, no account minimums, and FX conversion rates as low as 0.03%, far better than what most brokers offer.
Sponsored ContentValuation is complex, but we're here to simplify it.
Discover if Keda Industrial Group might be undervalued or overvalued with our detailed analysis, featuring fair value estimates, potential risks, dividends, insider trades, and its financial condition.
Access Free AnalysisHave feedback on this article? Concerned about the content? Get in touch with us directly. Alternatively, email editorial-team (at) simplywallst.com.
This article by Simply Wall St is general in nature. We provide commentary based on historical data and analyst forecasts only using an unbiased methodology and our articles are not intended to be financial advice. It does not constitute a recommendation to buy or sell any stock, and does not take account of your objectives, or your financial situation. We aim to bring you long-term focused analysis driven by fundamental data. Note that our analysis may not factor in the latest price-sensitive company announcements or qualitative material. Simply Wall St has no position in any stocks mentioned.
About SHSE:600499
Keda Industrial Group
Manufactures and sells building material machinery in China and internationally.
Excellent balance sheet with reasonable growth potential and pays a dividend.

