- China
- /
- Electrical
- /
- SHSE:600406
These 4 Measures Indicate That NARI Technology (SHSE:600406) Is Using Debt Safely

David Iben put it well when he said, 'Volatility is not a risk we care about. What we care about is avoiding the permanent loss of capital.' When we think about how risky a company is, we always like to look at its use of debt, since debt overload can lead to ruin. We note that NARI Technology Co., Ltd. (SHSE:600406) does have debt on its balance sheet. But should shareholders be worried about its use of debt?
When Is Debt A Problem?
Debt and other liabilities become risky for a business when it cannot easily fulfill those obligations, either with free cash flow or by raising capital at an attractive price. In the worst case scenario, a company can go bankrupt if it cannot pay its creditors. However, a more common (but still painful) scenario is that it has to raise new equity capital at a low price, thus permanently diluting shareholders. Of course, plenty of companies use debt to fund growth, without any negative consequences. The first step when considering a company's debt levels is to consider its cash and debt together.
View our latest analysis for NARI Technology
What Is NARI Technology's Net Debt?
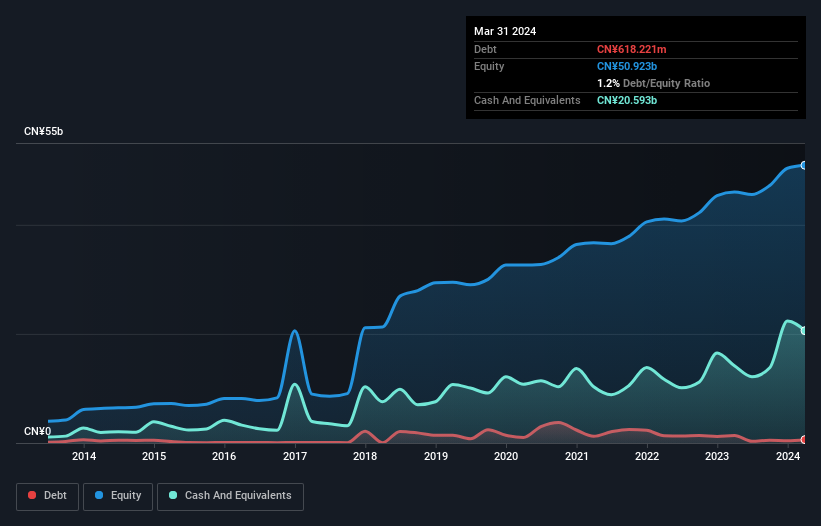
As you can see below, NARI Technology had CN¥618.2m of debt at March 2024, down from CN¥1.39b a year prior. But on the other hand it also has CN¥20.6b in cash, leading to a CN¥20.0b net cash position.
How Healthy Is NARI Technology's Balance Sheet?
The latest balance sheet data shows that NARI Technology had liabilities of CN¥31.6b due within a year, and liabilities of CN¥616.4m falling due after that. On the other hand, it had cash of CN¥20.6b and CN¥28.5b worth of receivables due within a year. So it can boast CN¥16.8b more liquid assets than total liabilities.
This short term liquidity is a sign that NARI Technology could probably pay off its debt with ease, as its balance sheet is far from stretched. Simply put, the fact that NARI Technology has more cash than debt is arguably a good indication that it can manage its debt safely.
Fortunately, NARI Technology grew its EBIT by 7.9% in the last year, making that debt load look even more manageable. There's no doubt that we learn most about debt from the balance sheet. But it is future earnings, more than anything, that will determine NARI Technology's ability to maintain a healthy balance sheet going forward. So if you're focused on the future you can check out this free report showing analyst profit forecasts.
Finally, a company can only pay off debt with cold hard cash, not accounting profits. While NARI Technology has net cash on its balance sheet, it's still worth taking a look at its ability to convert earnings before interest and tax (EBIT) to free cash flow, to help us understand how quickly it is building (or eroding) that cash balance. Over the last three years, NARI Technology recorded free cash flow worth a fulsome 83% of its EBIT, which is stronger than we'd usually expect. That positions it well to pay down debt if desirable to do so.
Summing Up
While it is always sensible to investigate a company's debt, in this case NARI Technology has CN¥20.0b in net cash and a decent-looking balance sheet. The cherry on top was that in converted 83% of that EBIT to free cash flow, bringing in CN¥11b. So is NARI Technology's debt a risk? It doesn't seem so to us. When analysing debt levels, the balance sheet is the obvious place to start. However, not all investment risk resides within the balance sheet - far from it. These risks can be hard to spot. Every company has them, and we've spotted 1 warning sign for NARI Technology you should know about.
If you're interested in investing in businesses that can grow profits without the burden of debt, then check out this free list of growing businesses that have net cash on the balance sheet.
If you're looking to trade NARI Technology, open an account with the lowest-cost platform trusted by professionals, Interactive Brokers.
With clients in over 200 countries and territories, and access to 160 markets, IBKR lets you trade stocks, options, futures, forex, bonds and funds from a single integrated account.
Enjoy no hidden fees, no account minimums, and FX conversion rates as low as 0.03%, far better than what most brokers offer.
Sponsored ContentValuation is complex, but we're here to simplify it.
Discover if NARI Technology might be undervalued or overvalued with our detailed analysis, featuring fair value estimates, potential risks, dividends, insider trades, and its financial condition.
Access Free AnalysisHave feedback on this article? Concerned about the content? Get in touch with us directly. Alternatively, email editorial-team (at) simplywallst.com.
This article by Simply Wall St is general in nature. We provide commentary based on historical data and analyst forecasts only using an unbiased methodology and our articles are not intended to be financial advice. It does not constitute a recommendation to buy or sell any stock, and does not take account of your objectives, or your financial situation. We aim to bring you long-term focused analysis driven by fundamental data. Note that our analysis may not factor in the latest price-sensitive company announcements or qualitative material. Simply Wall St has no position in any stocks mentioned.
About SHSE:600406
NARI Technology
Provides power intelligence solutions in China and internationally.
Flawless balance sheet, undervalued and pays a dividend.

