
Advertisement
Revenues Not Telling The Story For Xi'an Typical Industries Co.,Ltd (SHSE:600302) After Shares Rise 26%
Those holding Xi'an Typical Industries Co.,Ltd (SHSE:600302) shares would be relieved that the share price has rebounded 26% in the last thirty days, but it needs to keep going to repair the recent damage it has caused to investor portfolios. Not all shareholders will be feeling jubilant, since the share price is still down a very disappointing 16% in the last twelve months.
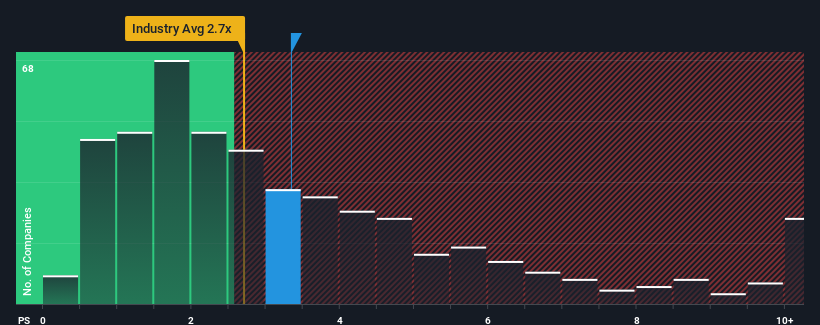
Since its price has surged higher, when almost half of the companies in China's Machinery industry have price-to-sales ratios (or "P/S") below 2.7x, you may consider Xi'an Typical IndustriesLtd as a stock probably not worth researching with its 3.3x P/S ratio. Although, it's not wise to just take the P/S at face value as there may be an explanation why it's as high as it is.
View our latest analysis for Xi'an Typical IndustriesLtd
How Has Xi'an Typical IndustriesLtd Performed Recently?
For instance, Xi'an Typical IndustriesLtd's receding revenue in recent times would have to be some food for thought. Perhaps the market believes the company can do enough to outperform the rest of the industry in the near future, which is keeping the P/S ratio high. However, if this isn't the case, investors might get caught out paying too much for the stock.
Want the full picture on earnings, revenue and cash flow for the company? Then our free report on Xi'an Typical IndustriesLtd will help you shine a light on its historical performance.What Are Revenue Growth Metrics Telling Us About The High P/S?
The only time you'd be truly comfortable seeing a P/S as high as Xi'an Typical IndustriesLtd's is when the company's growth is on track to outshine the industry.
Retrospectively, the last year delivered a frustrating 59% decrease to the company's top line. This means it has also seen a slide in revenue over the longer-term as revenue is down 32% in total over the last three years. Therefore, it's fair to say the revenue growth recently has been undesirable for the company.
In contrast to the company, the rest of the industry is expected to grow by 27% over the next year, which really puts the company's recent medium-term revenue decline into perspective.
With this in mind, we find it worrying that Xi'an Typical IndustriesLtd's P/S exceeds that of its industry peers. Apparently many investors in the company are way more bullish than recent times would indicate and aren't willing to let go of their stock at any price. Only the boldest would assume these prices are sustainable as a continuation of recent revenue trends is likely to weigh heavily on the share price eventually.
What We Can Learn From Xi'an Typical IndustriesLtd's P/S?
Xi'an Typical IndustriesLtd's P/S is on the rise since its shares have risen strongly. Generally, our preference is to limit the use of the price-to-sales ratio to establishing what the market thinks about the overall health of a company.
We've established that Xi'an Typical IndustriesLtd currently trades on a much higher than expected P/S since its recent revenues have been in decline over the medium-term. Right now we aren't comfortable with the high P/S as this revenue performance is highly unlikely to support such positive sentiment for long. Unless the the circumstances surrounding the recent medium-term improve, it wouldn't be wrong to expect a a difficult period ahead for the company's shareholders.
You should always think about risks. Case in point, we've spotted 2 warning signs for Xi'an Typical IndustriesLtd you should be aware of.
If companies with solid past earnings growth is up your alley, you may wish to see this free collection of other companies with strong earnings growth and low P/E ratios.
New: AI Stock Screener & Alerts
Our new AI Stock Screener scans the market every day to uncover opportunities.
• Dividend Powerhouses (3%+ Yield)
• Undervalued Small Caps with Insider Buying
• High growth Tech and AI Companies
Or build your own from over 50 metrics.
Have feedback on this article? Concerned about the content? Get in touch with us directly. Alternatively, email editorial-team (at) simplywallst.com.
This article by Simply Wall St is general in nature. We provide commentary based on historical data and analyst forecasts only using an unbiased methodology and our articles are not intended to be financial advice. It does not constitute a recommendation to buy or sell any stock, and does not take account of your objectives, or your financial situation. We aim to bring you long-term focused analysis driven by fundamental data. Note that our analysis may not factor in the latest price-sensitive company announcements or qualitative material. Simply Wall St has no position in any stocks mentioned.
About SHSE:600302
Xi'an Typical IndustriesLtd
Engages in the research and development, production, and sale of industrial sewing machines.
Flawless balance sheet and overvalued.
Market Insights

Advertisement
Community Narratives
The Next Phase of Energy Storage: How NeoVolta Is Tackling America’s Power Crunch
Fair Value US$7.50|30.4% undervalued
MA
Community Contributor
Why EnSilica is Worth Possibly 13x its Current Price
Fair Value UK£5.00|89.5% undervalued
DO
Community Contributor
M&A Activity, Industry Diversification & A Defense Contract Monopoly Will Push BWXT For Healthy Long-Term Growth
Fair Value US$220.00|13.0% undervalued
CL
Community Contributor
A case for Cassiar Gold Corp (TSXV: GLDC) to reach CAD$8-10 before 2030 (X30-37)
Fair Value CA$10.00|96.5% undervalued
AG
Community Contributor