- China
- /
- Trade Distributors
- /
- SHSE:600203
Fujian Furi Electronics Co.,Ltd's (SHSE:600203) 27% Share Price Plunge Could Signal Some Risk


Fujian Furi Electronics Co.,Ltd (SHSE:600203) shares have retraced a considerable 27% in the last month, reversing a fair amount of their solid recent performance. Longer-term, the stock has been solid despite a difficult 30 days, gaining 10% in the last year.
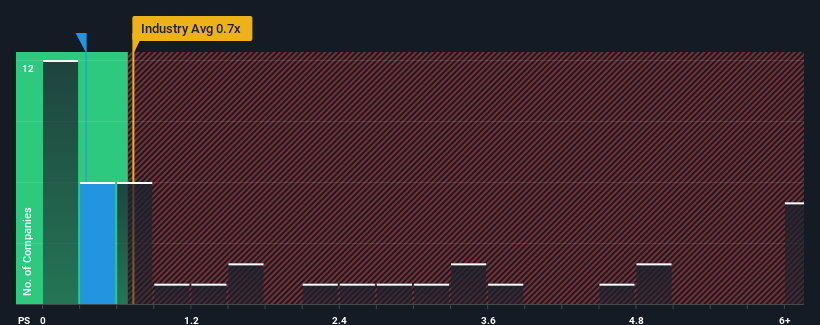
In spite of the heavy fall in price, you could still be forgiven for feeling indifferent about Fujian Furi ElectronicsLtd's P/S ratio of 0.3x, since the median price-to-sales (or "P/S") ratio for the Trade Distributors industry in China is also close to 0.7x. Although, it's not wise to simply ignore the P/S without explanation as investors may be disregarding a distinct opportunity or a costly mistake.
Check out our latest analysis for Fujian Furi ElectronicsLtd
What Does Fujian Furi ElectronicsLtd's Recent Performance Look Like?
As an illustration, revenue has deteriorated at Fujian Furi ElectronicsLtd over the last year, which is not ideal at all. It might be that many expect the company to put the disappointing revenue performance behind them over the coming period, which has kept the P/S from falling. If not, then existing shareholders may be a little nervous about the viability of the share price.
Although there are no analyst estimates available for Fujian Furi ElectronicsLtd, take a look at this free data-rich visualisation to see how the company stacks up on earnings, revenue and cash flow.Do Revenue Forecasts Match The P/S Ratio?
Fujian Furi ElectronicsLtd's P/S ratio would be typical for a company that's only expected to deliver moderate growth, and importantly, perform in line with the industry.
In reviewing the last year of financials, we were disheartened to see the company's revenues fell to the tune of 22%. As a result, revenue from three years ago have also fallen 25% overall. So unfortunately, we have to acknowledge that the company has not done a great job of growing revenue over that time.
In contrast to the company, the rest of the industry is expected to grow by 23% over the next year, which really puts the company's recent medium-term revenue decline into perspective.
With this information, we find it concerning that Fujian Furi ElectronicsLtd is trading at a fairly similar P/S compared to the industry. It seems most investors are ignoring the recent poor growth rate and are hoping for a turnaround in the company's business prospects. Only the boldest would assume these prices are sustainable as a continuation of recent revenue trends is likely to weigh on the share price eventually.
The Bottom Line On Fujian Furi ElectronicsLtd's P/S
Following Fujian Furi ElectronicsLtd's share price tumble, its P/S is just clinging on to the industry median P/S. Using the price-to-sales ratio alone to determine if you should sell your stock isn't sensible, however it can be a practical guide to the company's future prospects.
Our look at Fujian Furi ElectronicsLtd revealed its shrinking revenues over the medium-term haven't impacted the P/S as much as we anticipated, given the industry is set to grow. When we see revenue heading backwards in the context of growing industry forecasts, it'd make sense to expect a possible share price decline on the horizon, sending the moderate P/S lower. If recent medium-term revenue trends continue, it will place shareholders' investments at risk and potential investors in danger of paying an unnecessary premium.
Don't forget that there may be other risks. For instance, we've identified 2 warning signs for Fujian Furi ElectronicsLtd that you should be aware of.
If strong companies turning a profit tickle your fancy, then you'll want to check out this free list of interesting companies that trade on a low P/E (but have proven they can grow earnings).
If you're looking to trade Fujian Furi ElectronicsLtd, open an account with the lowest-cost platform trusted by professionals, Interactive Brokers.
With clients in over 200 countries and territories, and access to 160 markets, IBKR lets you trade stocks, options, futures, forex, bonds and funds from a single integrated account.
Enjoy no hidden fees, no account minimums, and FX conversion rates as low as 0.03%, far better than what most brokers offer.
Sponsored ContentNew: AI Stock Screener & Alerts
Our new AI Stock Screener scans the market every day to uncover opportunities.
• Dividend Powerhouses (3%+ Yield)
• Undervalued Small Caps with Insider Buying
• High growth Tech and AI Companies
Or build your own from over 50 metrics.
Have feedback on this article? Concerned about the content? Get in touch with us directly. Alternatively, email editorial-team (at) simplywallst.com.
This article by Simply Wall St is general in nature. We provide commentary based on historical data and analyst forecasts only using an unbiased methodology and our articles are not intended to be financial advice. It does not constitute a recommendation to buy or sell any stock, and does not take account of your objectives, or your financial situation. We aim to bring you long-term focused analysis driven by fundamental data. Note that our analysis may not factor in the latest price-sensitive company announcements or qualitative material. Simply Wall St has no position in any stocks mentioned.
About SHSE:600203
Fujian Furi ElectronicsLtd
Engages in the research, development, production, and sale of smart terminal and LED optoelectronic products in China.
Mediocre balance sheet and slightly overvalued.
Market Insights

Community Narratives

