- China
- /
- Trade Distributors
- /
- SHSE:600203
Estimating The Fair Value Of Fujian Furi Electronics Co.,Ltd (SHSE:600203)


Key Insights
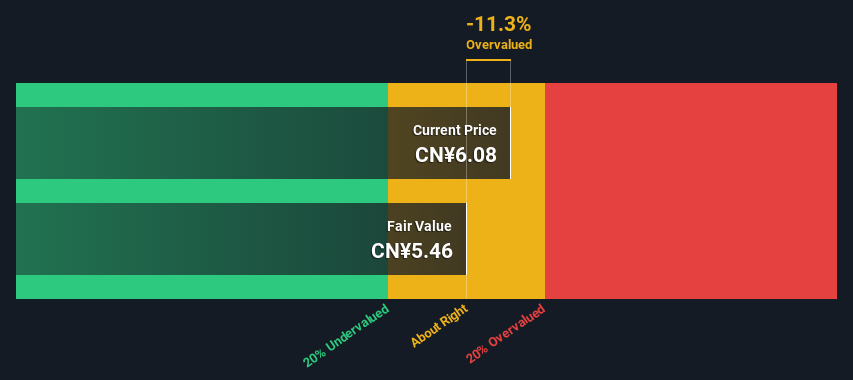
- Using the 2 Stage Free Cash Flow to Equity, Fujian Furi ElectronicsLtd fair value estimate is CN¥5.46
- Current share price of CN¥6.08 suggests Fujian Furi ElectronicsLtd is potentially trading close to its fair value
- Fujian Furi ElectronicsLtd's peers seem to be trading at a higher premium to fair value based onthe industry average of -376%
Today we will run through one way of estimating the intrinsic value of Fujian Furi Electronics Co.,Ltd (SHSE:600203) by taking the expected future cash flows and discounting them to their present value. We will use the Discounted Cash Flow (DCF) model on this occasion. Don't get put off by the jargon, the math behind it is actually quite straightforward.
We generally believe that a company's value is the present value of all of the cash it will generate in the future. However, a DCF is just one valuation metric among many, and it is not without flaws. Anyone interested in learning a bit more about intrinsic value should have a read of the Simply Wall St analysis model.
View our latest analysis for Fujian Furi ElectronicsLtd
Crunching The Numbers
We are going to use a two-stage DCF model, which, as the name states, takes into account two stages of growth. The first stage is generally a higher growth period which levels off heading towards the terminal value, captured in the second 'steady growth' period. To begin with, we have to get estimates of the next ten years of cash flows. Seeing as no analyst estimates of free cash flow are available to us, we have extrapolate the previous free cash flow (FCF) from the company's last reported value. We assume companies with shrinking free cash flow will slow their rate of shrinkage, and that companies with growing free cash flow will see their growth rate slow, over this period. We do this to reflect that growth tends to slow more in the early years than it does in later years.
A DCF is all about the idea that a dollar in the future is less valuable than a dollar today, so we discount the value of these future cash flows to their estimated value in today's dollars:
10-year free cash flow (FCF) estimate
| 2024 | 2025 | 2026 | 2027 | 2028 | 2029 | 2030 | 2031 | 2032 | 2033 | |
| Levered FCF (CN¥, Millions) | CN¥94.8m | CN¥138.0m | CN¥183.4m | CN¥227.1m | CN¥267.0m | CN¥302.1m | CN¥332.6m | CN¥359.0m | CN¥382.0m | CN¥402.5m |
| Growth Rate Estimate Source | Est @ 63.98% | Est @ 45.65% | Est @ 32.83% | Est @ 23.85% | Est @ 17.56% | Est @ 13.17% | Est @ 10.09% | Est @ 7.93% | Est @ 6.42% | Est @ 5.36% |
| Present Value (CN¥, Millions) Discounted @ 11% | CN¥85.4 | CN¥112 | CN¥134 | CN¥150 | CN¥159 | CN¥162 | CN¥161 | CN¥156 | CN¥150 | CN¥143 |
("Est" = FCF growth rate estimated by Simply Wall St)
Present Value of 10-year Cash Flow (PVCF) = CN¥1.4b
The second stage is also known as Terminal Value, this is the business's cash flow after the first stage. For a number of reasons a very conservative growth rate is used that cannot exceed that of a country's GDP growth. In this case we have used the 5-year average of the 10-year government bond yield (2.9%) to estimate future growth. In the same way as with the 10-year 'growth' period, we discount future cash flows to today's value, using a cost of equity of 11%.
Terminal Value (TV)= FCF2033 × (1 + g) ÷ (r – g) = CN¥403m× (1 + 2.9%) ÷ (11%– 2.9%) = CN¥5.2b
Present Value of Terminal Value (PVTV)= TV / (1 + r)10= CN¥5.2b÷ ( 1 + 11%)10= CN¥1.8b
The total value, or equity value, is then the sum of the present value of the future cash flows, which in this case is CN¥3.2b. To get the intrinsic value per share, we divide this by the total number of shares outstanding. Relative to the current share price of CN¥6.1, the company appears around fair value at the time of writing. The assumptions in any calculation have a big impact on the valuation, so it is better to view this as a rough estimate, not precise down to the last cent.
The Assumptions
Now the most important inputs to a discounted cash flow are the discount rate, and of course, the actual cash flows. Part of investing is coming up with your own evaluation of a company's future performance, so try the calculation yourself and check your own assumptions. The DCF also does not consider the possible cyclicality of an industry, or a company's future capital requirements, so it does not give a full picture of a company's potential performance. Given that we are looking at Fujian Furi ElectronicsLtd as potential shareholders, the cost of equity is used as the discount rate, rather than the cost of capital (or weighted average cost of capital, WACC) which accounts for debt. In this calculation we've used 11%, which is based on a levered beta of 1.428. Beta is a measure of a stock's volatility, compared to the market as a whole. We get our beta from the industry average beta of globally comparable companies, with an imposed limit between 0.8 and 2.0, which is a reasonable range for a stable business.
SWOT Analysis for Fujian Furi ElectronicsLtd
- No major strengths identified for 600203.
- Current share price is above our estimate of fair value.
- Has sufficient cash runway for more than 3 years based on current free cash flows.
- Lack of analyst coverage makes it difficult to determine 600203's earnings prospects.
- Debt is not well covered by operating cash flow.
Looking Ahead:
Although the valuation of a company is important, it ideally won't be the sole piece of analysis you scrutinize for a company. DCF models are not the be-all and end-all of investment valuation. Instead the best use for a DCF model is to test certain assumptions and theories to see if they would lead to the company being undervalued or overvalued. If a company grows at a different rate, or if its cost of equity or risk free rate changes sharply, the output can look very different. For Fujian Furi ElectronicsLtd, there are three important factors you should further examine:
- Risks: As an example, we've found 2 warning signs for Fujian Furi ElectronicsLtd that you need to consider before investing here.
- Other High Quality Alternatives: Do you like a good all-rounder? Explore our interactive list of high quality stocks to get an idea of what else is out there you may be missing!
- Other Environmentally-Friendly Companies: Concerned about the environment and think consumers will buy eco-friendly products more and more? Browse through our interactive list of companies that are thinking about a greener future to discover some stocks you may not have thought of!
PS. The Simply Wall St app conducts a discounted cash flow valuation for every stock on the SHSE every day. If you want to find the calculation for other stocks just search here.
If you're looking to trade Fujian Furi ElectronicsLtd, open an account with the lowest-cost platform trusted by professionals, Interactive Brokers.
With clients in over 200 countries and territories, and access to 160 markets, IBKR lets you trade stocks, options, futures, forex, bonds and funds from a single integrated account.
Enjoy no hidden fees, no account minimums, and FX conversion rates as low as 0.03%, far better than what most brokers offer.
Sponsored ContentNew: AI Stock Screener & Alerts
Our new AI Stock Screener scans the market every day to uncover opportunities.
• Dividend Powerhouses (3%+ Yield)
• Undervalued Small Caps with Insider Buying
• High growth Tech and AI Companies
Or build your own from over 50 metrics.
Have feedback on this article? Concerned about the content? Get in touch with us directly. Alternatively, email editorial-team (at) simplywallst.com.
This article by Simply Wall St is general in nature. We provide commentary based on historical data and analyst forecasts only using an unbiased methodology and our articles are not intended to be financial advice. It does not constitute a recommendation to buy or sell any stock, and does not take account of your objectives, or your financial situation. We aim to bring you long-term focused analysis driven by fundamental data. Note that our analysis may not factor in the latest price-sensitive company announcements or qualitative material. Simply Wall St has no position in any stocks mentioned.
About SHSE:600203
Fujian Furi ElectronicsLtd
Engages in the research, development, production, and sale of smart terminal and LED optoelectronic products in China.
Mediocre balance sheet and slightly overvalued.
Market Insights

Community Narratives

