- China
- /
- Construction
- /
- SHSE:600039
Calculating The Fair Value Of Sichuan Road & Bridge Co.,Ltd (SHSE:600039)


Key Insights
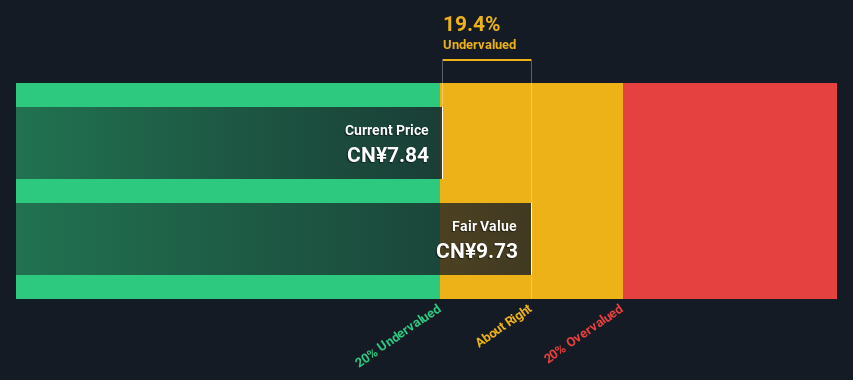
- Sichuan Road & BridgeLtd's estimated fair value is CN¥9.73 based on Dividend Discount Model
- With CN¥7.84 share price, Sichuan Road & BridgeLtd appears to be trading close to its estimated fair value
- The average premium for Sichuan Road & BridgeLtd's competitorsis currently 281%
Today we'll do a simple run through of a valuation method used to estimate the attractiveness of Sichuan Road & Bridge Co.,Ltd (SHSE:600039) as an investment opportunity by taking the expected future cash flows and discounting them to today's value. We will take advantage of the Discounted Cash Flow (DCF) model for this purpose. It may sound complicated, but actually it is quite simple!
Remember though, that there are many ways to estimate a company's value, and a DCF is just one method. If you want to learn more about discounted cash flow, the rationale behind this calculation can be read in detail in the Simply Wall St analysis model.
Check out our latest analysis for Sichuan Road & BridgeLtd
Is Sichuan Road & BridgeLtd Fairly Valued?
We have to calculate the value of Sichuan Road & BridgeLtd slightly differently to other stocks because it is a construction company. In this approach dividends per share (DPS) are used, as free cash flow is difficult to estimate and often not reported by analysts. Unless a company pays out the majority of its FCF as a dividend, this method will typically underestimate the value of the stock. We use the Gordon Growth Model, which assumes dividend will grow into perpetuity at a rate that can be sustained. For a number of reasons a very conservative growth rate is used that cannot exceed that of a company's Gross Domestic Product (GDP). In this case we used the 5-year average of the 10-year government bond yield (2.9%). The expected dividend per share is then discounted to today's value at a cost of equity of 9.6%. Compared to the current share price of CN¥7.8, the company appears about fair value at a 19% discount to where the stock price trades currently. The assumptions in any calculation have a big impact on the valuation, so it is better to view this as a rough estimate, not precise down to the last cent.
Value Per Share = Expected Dividend Per Share / (Discount Rate - Perpetual Growth Rate)
= CN¥0.6 / (9.6% – 2.9%)
= CN¥9.7
Important Assumptions
We would point out that the most important inputs to a discounted cash flow are the discount rate and of course the actual cash flows. Part of investing is coming up with your own evaluation of a company's future performance, so try the calculation yourself and check your own assumptions. The DCF also does not consider the possible cyclicality of an industry, or a company's future capital requirements, so it does not give a full picture of a company's potential performance. Given that we are looking at Sichuan Road & BridgeLtd as potential shareholders, the cost of equity is used as the discount rate, rather than the cost of capital (or weighted average cost of capital, WACC) which accounts for debt. In this calculation we've used 9.6%, which is based on a levered beta of 1.186. Beta is a measure of a stock's volatility, compared to the market as a whole. We get our beta from the industry average beta of globally comparable companies, with an imposed limit between 0.8 and 2.0, which is a reasonable range for a stable business.
SWOT Analysis for Sichuan Road & BridgeLtd
- Earnings growth over the past year exceeded the industry.
- Debt is well covered by earnings.
- Dividend is in the top 25% of dividend payers in the market.
- Earnings growth over the past year is below its 5-year average.
- Annual earnings are forecast to grow for the next 3 years.
- Good value based on P/E ratio and estimated fair value.
- Debt is not well covered by operating cash flow.
- Dividends are not covered by cash flow.
Looking Ahead:
Although the valuation of a company is important, it shouldn't be the only metric you look at when researching a company. The DCF model is not a perfect stock valuation tool. Instead the best use for a DCF model is to test certain assumptions and theories to see if they would lead to the company being undervalued or overvalued. For instance, if the terminal value growth rate is adjusted slightly, it can dramatically alter the overall result. For Sichuan Road & BridgeLtd, we've put together three pertinent elements you should assess:
- Risks: Take risks, for example - Sichuan Road & BridgeLtd has 2 warning signs (and 1 which doesn't sit too well with us) we think you should know about.
- Future Earnings: How does 600039's growth rate compare to its peers and the wider market? Dig deeper into the analyst consensus number for the upcoming years by interacting with our free analyst growth expectation chart.
- Other High Quality Alternatives: Do you like a good all-rounder? Explore our interactive list of high quality stocks to get an idea of what else is out there you may be missing!
PS. Simply Wall St updates its DCF calculation for every Chinese stock every day, so if you want to find the intrinsic value of any other stock just search here.
If you're looking to trade Sichuan Road & Bridge GroupLtd, open an account with the lowest-cost platform trusted by professionals, Interactive Brokers.
With clients in over 200 countries and territories, and access to 160 markets, IBKR lets you trade stocks, options, futures, forex, bonds and funds from a single integrated account.
Enjoy no hidden fees, no account minimums, and FX conversion rates as low as 0.03%, far better than what most brokers offer.
Sponsored ContentNew: Manage All Your Stock Portfolios in One Place
We've created the ultimate portfolio companion for stock investors, and it's free.
• Connect an unlimited number of Portfolios and see your total in one currency
• Be alerted to new Warning Signs or Risks via email or mobile
• Track the Fair Value of your stocks
Have feedback on this article? Concerned about the content? Get in touch with us directly. Alternatively, email editorial-team (at) simplywallst.com.
This article by Simply Wall St is general in nature. We provide commentary based on historical data and analyst forecasts only using an unbiased methodology and our articles are not intended to be financial advice. It does not constitute a recommendation to buy or sell any stock, and does not take account of your objectives, or your financial situation. We aim to bring you long-term focused analysis driven by fundamental data. Note that our analysis may not factor in the latest price-sensitive company announcements or qualitative material. Simply Wall St has no position in any stocks mentioned.
About SHSE:600039
Sichuan Road & Bridge GroupLtd
Engages in the investment, development, construction, and operation of engineering construction, mining, clean energy, and new materials in China and internationally.
Established dividend payer with adequate balance sheet.

