- China
- /
- Auto Components
- /
- SZSE:300391
Changjiang Pharmaceutical Group Co., Ltd. (SZSE:300391) Looks Inexpensive After Falling 38% But Perhaps Not Attractive Enough


Unfortunately for some shareholders, the Changjiang Pharmaceutical Group Co., Ltd. (SZSE:300391) share price has dived 38% in the last thirty days, prolonging recent pain. For any long-term shareholders, the last month ends a year to forget by locking in a 58% share price decline.
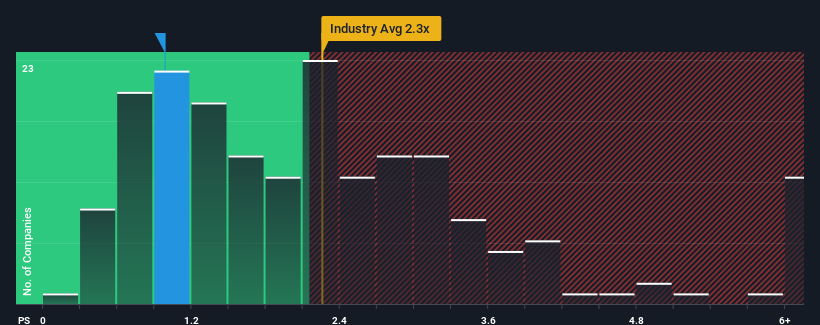
Since its price has dipped substantially, when close to half the companies operating in China's Auto Components industry have price-to-sales ratios (or "P/S") above 2.3x, you may consider Changjiang Pharmaceutical Group as an enticing stock to check out with its 1x P/S ratio. Although, it's not wise to just take the P/S at face value as there may be an explanation why it's limited.
View our latest analysis for Changjiang Pharmaceutical Group
How Has Changjiang Pharmaceutical Group Performed Recently?
For example, consider that Changjiang Pharmaceutical Group's financial performance has been poor lately as its revenue has been in decline. Perhaps the market believes the recent revenue performance isn't good enough to keep up the industry, causing the P/S ratio to suffer. If you like the company, you'd be hoping this isn't the case so that you could potentially pick up some stock while it's out of favour.
Want the full picture on earnings, revenue and cash flow for the company? Then our free report on Changjiang Pharmaceutical Group will help you shine a light on its historical performance.What Are Revenue Growth Metrics Telling Us About The Low P/S?
The only time you'd be truly comfortable seeing a P/S as low as Changjiang Pharmaceutical Group's is when the company's growth is on track to lag the industry.
Taking a look back first, the company's revenue growth last year wasn't something to get excited about as it posted a disappointing decline of 38%. Even so, admirably revenue has lifted 55% in aggregate from three years ago, notwithstanding the last 12 months. Accordingly, while they would have preferred to keep the run going, shareholders would definitely welcome the medium-term rates of revenue growth.
This is in contrast to the rest of the industry, which is expected to grow by 25% over the next year, materially higher than the company's recent medium-term annualised growth rates.
With this in consideration, it's easy to understand why Changjiang Pharmaceutical Group's P/S falls short of the mark set by its industry peers. Apparently many shareholders weren't comfortable holding on to something they believe will continue to trail the wider industry.
What We Can Learn From Changjiang Pharmaceutical Group's P/S?
The southerly movements of Changjiang Pharmaceutical Group's shares means its P/S is now sitting at a pretty low level. Typically, we'd caution against reading too much into price-to-sales ratios when settling on investment decisions, though it can reveal plenty about what other market participants think about the company.
In line with expectations, Changjiang Pharmaceutical Group maintains its low P/S on the weakness of its recent three-year growth being lower than the wider industry forecast. At this stage investors feel the potential for an improvement in revenue isn't great enough to justify a higher P/S ratio. If recent medium-term revenue trends continue, it's hard to see the share price experience a reversal of fortunes anytime soon.
We don't want to rain on the parade too much, but we did also find 1 warning sign for Changjiang Pharmaceutical Group that you need to be mindful of.
If strong companies turning a profit tickle your fancy, then you'll want to check out this free list of interesting companies that trade on a low P/E (but have proven they can grow earnings).
If you're looking to trade Changjiang Pharmaceutical Group, open an account with the lowest-cost platform trusted by professionals, Interactive Brokers.
With clients in over 200 countries and territories, and access to 160 markets, IBKR lets you trade stocks, options, futures, forex, bonds and funds from a single integrated account.
Enjoy no hidden fees, no account minimums, and FX conversion rates as low as 0.03%, far better than what most brokers offer.
Sponsored ContentNew: AI Stock Screener & Alerts
Our new AI Stock Screener scans the market every day to uncover opportunities.
• Dividend Powerhouses (3%+ Yield)
• Undervalued Small Caps with Insider Buying
• High growth Tech and AI Companies
Or build your own from over 50 metrics.
Have feedback on this article? Concerned about the content? Get in touch with us directly. Alternatively, email editorial-team (at) simplywallst.com.
This article by Simply Wall St is general in nature. We provide commentary based on historical data and analyst forecasts only using an unbiased methodology and our articles are not intended to be financial advice. It does not constitute a recommendation to buy or sell any stock, and does not take account of your objectives, or your financial situation. We aim to bring you long-term focused analysis driven by fundamental data. Note that our analysis may not factor in the latest price-sensitive company announcements or qualitative material. Simply Wall St has no position in any stocks mentioned.
About SZSE:300391
Changjiang Pharmaceutical Group
Engages in the production and distribution of pharmaceuticals and photovoltaic equipment in China and internationally.
Slight and overvalued.
Market Insights

Community Narratives

