Stock Analysis
- China
- /
- Auto Components
- /
- SHSE:603809
The total return for Chengdu Haoneng Technology (SHSE:603809) investors has risen faster than earnings growth over the last five years


Chengdu Haoneng Technology Co., Ltd. (SHSE:603809) shareholders might be concerned after seeing the share price drop 11% in the last month. But that doesn't change the fact that the returns over the last five years have been pleasing. It has returned a market beating 95% in that time.
In light of the stock dropping 9.5% in the past week, we want to investigate the longer term story, and see if fundamentals have been the driver of the company's positive five-year return.
Check out our latest analysis for Chengdu Haoneng Technology
There is no denying that markets are sometimes efficient, but prices do not always reflect underlying business performance. One way to examine how market sentiment has changed over time is to look at the interaction between a company's share price and its earnings per share (EPS).
During five years of share price growth, Chengdu Haoneng Technology achieved compound earnings per share (EPS) growth of 6.7% per year. This EPS growth is slower than the share price growth of 14% per year, over the same period. This suggests that market participants hold the company in higher regard, these days. And that's hardly shocking given the track record of growth.
The company's earnings per share (over time) is depicted in the image below (click to see the exact numbers).
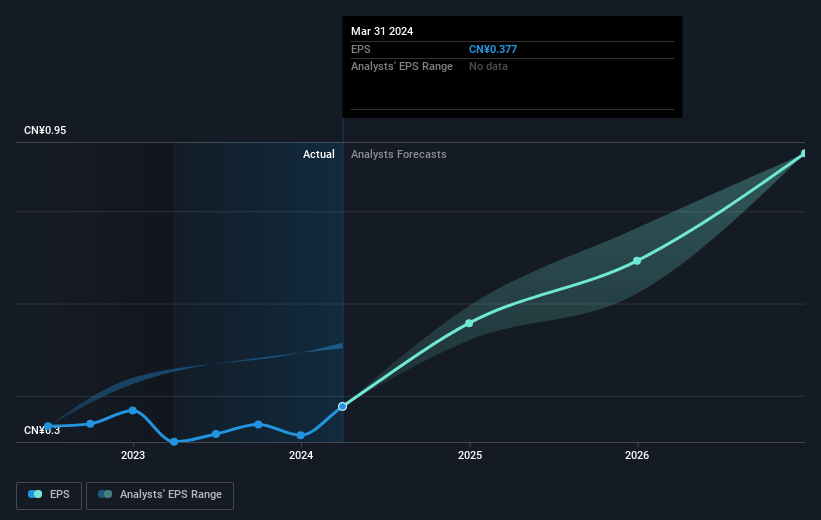
We know that Chengdu Haoneng Technology has improved its bottom line lately, but is it going to grow revenue? This free report showing analyst revenue forecasts should help you figure out if the EPS growth can be sustained.
What About Dividends?
As well as measuring the share price return, investors should also consider the total shareholder return (TSR). The TSR incorporates the value of any spin-offs or discounted capital raisings, along with any dividends, based on the assumption that the dividends are reinvested. It's fair to say that the TSR gives a more complete picture for stocks that pay a dividend. As it happens, Chengdu Haoneng Technology's TSR for the last 5 years was 112%, which exceeds the share price return mentioned earlier. And there's no prize for guessing that the dividend payments largely explain the divergence!
A Different Perspective
We're pleased to report that Chengdu Haoneng Technology shareholders have received a total shareholder return of 5.7% over one year. That's including the dividend. However, that falls short of the 16% TSR per annum it has made for shareholders, each year, over five years. Potential buyers might understandably feel they've missed the opportunity, but it's always possible business is still firing on all cylinders. I find it very interesting to look at share price over the long term as a proxy for business performance. But to truly gain insight, we need to consider other information, too. Take risks, for example - Chengdu Haoneng Technology has 3 warning signs we think you should be aware of.
If you like to buy stocks alongside management, then you might just love this free list of companies. (Hint: many of them are unnoticed AND have attractive valuation).
Please note, the market returns quoted in this article reflect the market weighted average returns of stocks that currently trade on Chinese exchanges.
New: AI Stock Screener & Alerts
Our new AI Stock Screener scans the market every day to uncover opportunities.
• Dividend Powerhouses (3%+ Yield)
• Undervalued Small Caps with Insider Buying
• High growth Tech and AI Companies
Or build your own from over 50 metrics.
Have feedback on this article? Concerned about the content? Get in touch with us directly. Alternatively, email editorial-team (at) simplywallst.com.
This article by Simply Wall St is general in nature. We provide commentary based on historical data and analyst forecasts only using an unbiased methodology and our articles are not intended to be financial advice. It does not constitute a recommendation to buy or sell any stock, and does not take account of your objectives, or your financial situation. We aim to bring you long-term focused analysis driven by fundamental data. Note that our analysis may not factor in the latest price-sensitive company announcements or qualitative material. Simply Wall St has no position in any stocks mentioned.
Have feedback on this article? Concerned about the content? Get in touch with us directly. Alternatively, email editorial-team@simplywallst.com
About SHSE:603809
Chengdu Haoneng Technology
Engages in the research, development, production, and sale of automotive transmission system components in China and internationally.
Reasonable growth potential with adequate balance sheet.
