
Advertisement
- China
- /
- Auto Components
- /
- SHSE:603158
Changzhou Tenglong AutoPartsCo.,Ltd. (SHSE:603158) Soars 30% But It's A Story Of Risk Vs Reward
Changzhou Tenglong AutoPartsCo.,Ltd. (SHSE:603158) shareholders are no doubt pleased to see that the share price has bounced 30% in the last month, although it is still struggling to make up recently lost ground. But the gains over the last month weren't enough to make shareholders whole, as the share price is still down 3.9% in the last twelve months.
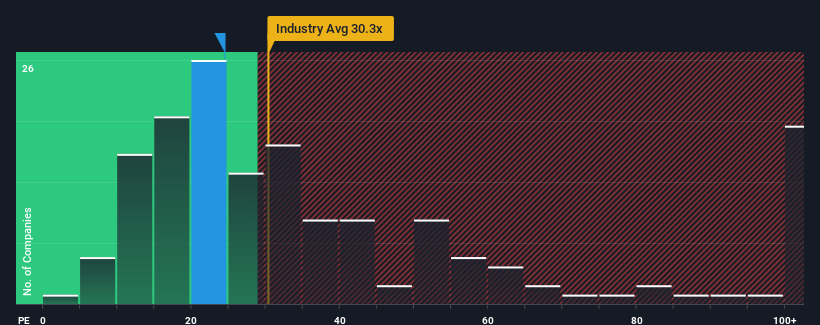
Although its price has surged higher, Changzhou Tenglong AutoPartsCo.Ltd's price-to-earnings (or "P/E") ratio of 24.5x might still make it look like a buy right now compared to the market in China, where around half of the companies have P/E ratios above 30x and even P/E's above 55x are quite common. However, the P/E might be low for a reason and it requires further investigation to determine if it's justified.
Changzhou Tenglong AutoPartsCo.Ltd certainly has been doing a good job lately as its earnings growth has been positive while most other companies have been seeing their earnings go backwards. One possibility is that the P/E is low because investors think the company's earnings are going to fall away like everyone else's soon. If not, then existing shareholders have reason to be quite optimistic about the future direction of the share price.
See our latest analysis for Changzhou Tenglong AutoPartsCo.Ltd
What Are Growth Metrics Telling Us About The Low P/E?
In order to justify its P/E ratio, Changzhou Tenglong AutoPartsCo.Ltd would need to produce sluggish growth that's trailing the market.
Taking a look back first, we see that the company grew earnings per share by an impressive 72% last year. Despite this strong recent growth, it's still struggling to catch up as its three-year EPS frustratingly shrank by 6.2% overall. Accordingly, shareholders would have felt downbeat about the medium-term rates of earnings growth.
Looking ahead now, EPS is anticipated to climb by 39% during the coming year according to the only analyst following the company. That's shaping up to be similar to the 41% growth forecast for the broader market.
With this information, we find it odd that Changzhou Tenglong AutoPartsCo.Ltd is trading at a P/E lower than the market. Apparently some shareholders are doubtful of the forecasts and have been accepting lower selling prices.
What We Can Learn From Changzhou Tenglong AutoPartsCo.Ltd's P/E?
Despite Changzhou Tenglong AutoPartsCo.Ltd's shares building up a head of steam, its P/E still lags most other companies. Using the price-to-earnings ratio alone to determine if you should sell your stock isn't sensible, however it can be a practical guide to the company's future prospects.
Our examination of Changzhou Tenglong AutoPartsCo.Ltd's analyst forecasts revealed that its market-matching earnings outlook isn't contributing to its P/E as much as we would have predicted. There could be some unobserved threats to earnings preventing the P/E ratio from matching the outlook. It appears some are indeed anticipating earnings instability, because these conditions should normally provide more support to the share price.
Before you settle on your opinion, we've discovered 1 warning sign for Changzhou Tenglong AutoPartsCo.Ltd that you should be aware of.
Of course, you might also be able to find a better stock than Changzhou Tenglong AutoPartsCo.Ltd. So you may wish to see this free collection of other companies that have reasonable P/E ratios and have grown earnings strongly.
New: AI Stock Screener & Alerts
Our new AI Stock Screener scans the market every day to uncover opportunities.
• Dividend Powerhouses (3%+ Yield)
• Undervalued Small Caps with Insider Buying
• High growth Tech and AI Companies
Or build your own from over 50 metrics.
Have feedback on this article? Concerned about the content? Get in touch with us directly. Alternatively, email editorial-team (at) simplywallst.com.
This article by Simply Wall St is general in nature. We provide commentary based on historical data and analyst forecasts only using an unbiased methodology and our articles are not intended to be financial advice. It does not constitute a recommendation to buy or sell any stock, and does not take account of your objectives, or your financial situation. We aim to bring you long-term focused analysis driven by fundamental data. Note that our analysis may not factor in the latest price-sensitive company announcements or qualitative material. Simply Wall St has no position in any stocks mentioned.
About SHSE:603158
Changzhou Tenglong AutoPartsCo.Ltd
Researches, develops, manufactures, and sells auto parts in China and internationally.
Flawless balance sheet and fair value.
Similar Companies
Market Insights

Advertisement
Community Narratives
Kodiak AI - a potential 100 bagger opportunity?
Fair Value US$14.00|41.9% undervalued
DA
Community Contributor
A Fair Price for a Great Business Facing Real Threats
Fair Value US$383.06|14.1% undervalued
IM
Community Contributor
AXON And Shopify Integration Will Unlock Global Mobile Advertising
Fair Value US$613.59|1.3% undervalued
AN
Based on Analyst Price Targets