
Advertisement
- China
- /
- Auto Components
- /
- SHSE:601058
Sailun Group Co., Ltd. (SHSE:601058) Shares Could Be 21% Below Their Intrinsic Value Estimate

Key Insights
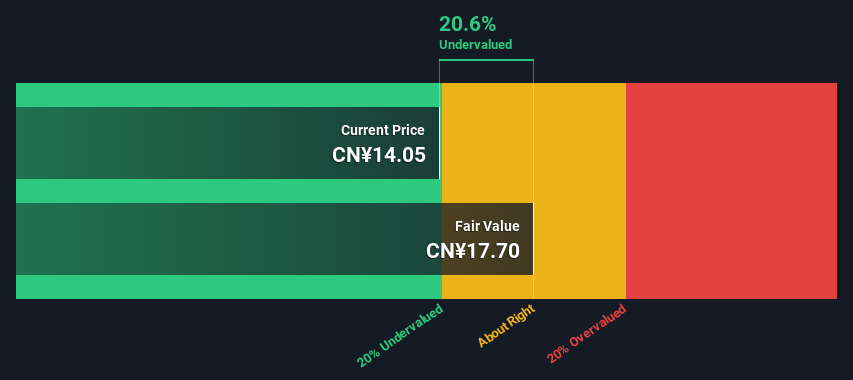
- The projected fair value for Sailun Group is CN¥17.70 based on 2 Stage Free Cash Flow to Equity
- Current share price of CN¥14.05 suggests Sailun Group is potentially 21% undervalued
- The CN¥15.89 analyst price target for 601058 is 10% less than our estimate of fair value
In this article we are going to estimate the intrinsic value of Sailun Group Co., Ltd. (SHSE:601058) by taking the forecast future cash flows of the company and discounting them back to today's value. This will be done using the Discounted Cash Flow (DCF) model. Believe it or not, it's not too difficult to follow, as you'll see from our example!
Remember though, that there are many ways to estimate a company's value, and a DCF is just one method. For those who are keen learners of equity analysis, the Simply Wall St analysis model here may be something of interest to you.
View our latest analysis for Sailun Group
Is Sailun Group Fairly Valued?
We're using the 2-stage growth model, which simply means we take in account two stages of company's growth. In the initial period the company may have a higher growth rate and the second stage is usually assumed to have a stable growth rate. To start off with, we need to estimate the next ten years of cash flows. Seeing as no analyst estimates of free cash flow are available to us, we have extrapolate the previous free cash flow (FCF) from the company's last reported value. We assume companies with shrinking free cash flow will slow their rate of shrinkage, and that companies with growing free cash flow will see their growth rate slow, over this period. We do this to reflect that growth tends to slow more in the early years than it does in later years.
A DCF is all about the idea that a dollar in the future is less valuable than a dollar today, so we discount the value of these future cash flows to their estimated value in today's dollars:
10-year free cash flow (FCF) estimate
| 2024 | 2025 | 2026 | 2027 | 2028 | 2029 | 2030 | 2031 | 2032 | 2033 | |
| Levered FCF (CN¥, Millions) | CN¥1.65b | CN¥2.35b | CN¥3.07b | CN¥3.75b | CN¥4.37b | CN¥4.91b | CN¥5.38b | CN¥5.79b | CN¥6.15b | CN¥6.47b |
| Growth Rate Estimate Source | Est @ 59.17% | Est @ 42.30% | Est @ 30.49% | Est @ 22.23% | Est @ 16.44% | Est @ 12.39% | Est @ 9.55% | Est @ 7.57% | Est @ 6.18% | Est @ 5.21% |
| Present Value (CN¥, Millions) Discounted @ 11% | CN¥1.5k | CN¥1.9k | CN¥2.3k | CN¥2.5k | CN¥2.6k | CN¥2.7k | CN¥2.7k | CN¥2.6k | CN¥2.5k | CN¥2.4k |
("Est" = FCF growth rate estimated by Simply Wall St)
Present Value of 10-year Cash Flow (PVCF) = CN¥24b
The second stage is also known as Terminal Value, this is the business's cash flow after the first stage. The Gordon Growth formula is used to calculate Terminal Value at a future annual growth rate equal to the 5-year average of the 10-year government bond yield of 2.9%. We discount the terminal cash flows to today's value at a cost of equity of 11%.
Terminal Value (TV)= FCF2033 × (1 + g) ÷ (r – g) = CN¥6.5b× (1 + 2.9%) ÷ (11%– 2.9%) = CN¥88b
Present Value of Terminal Value (PVTV)= TV / (1 + r)10= CN¥88b÷ ( 1 + 11%)10= CN¥32b
The total value, or equity value, is then the sum of the present value of the future cash flows, which in this case is CN¥56b. In the final step we divide the equity value by the number of shares outstanding. Compared to the current share price of CN¥14.1, the company appears a touch undervalued at a 21% discount to where the stock price trades currently. Remember though, that this is just an approximate valuation, and like any complex formula - garbage in, garbage out.
The Assumptions
The calculation above is very dependent on two assumptions. The first is the discount rate and the other is the cash flows. Part of investing is coming up with your own evaluation of a company's future performance, so try the calculation yourself and check your own assumptions. The DCF also does not consider the possible cyclicality of an industry, or a company's future capital requirements, so it does not give a full picture of a company's potential performance. Given that we are looking at Sailun Group as potential shareholders, the cost of equity is used as the discount rate, rather than the cost of capital (or weighted average cost of capital, WACC) which accounts for debt. In this calculation we've used 11%, which is based on a levered beta of 1.351. Beta is a measure of a stock's volatility, compared to the market as a whole. We get our beta from the industry average beta of globally comparable companies, with an imposed limit between 0.8 and 2.0, which is a reasonable range for a stable business.
SWOT Analysis for Sailun Group
Strength
- Earnings growth over the past year exceeded the industry.
- Debt is not viewed as a risk.
- Dividends are covered by earnings and cash flows.
Weakness
- Dividend is low compared to the top 25% of dividend payers in the Auto Components market.
- Shareholders have been diluted in the past year.
Opportunity
- Annual revenue is forecast to grow faster than the Chinese market.
- Good value based on P/E ratio and estimated fair value.
Threat
- Annual earnings are forecast to grow slower than the Chinese market.
Looking Ahead:
Whilst important, the DCF calculation shouldn't be the only metric you look at when researching a company. The DCF model is not a perfect stock valuation tool. Instead the best use for a DCF model is to test certain assumptions and theories to see if they would lead to the company being undervalued or overvalued. For instance, if the terminal value growth rate is adjusted slightly, it can dramatically alter the overall result. Can we work out why the company is trading at a discount to intrinsic value? For Sailun Group, we've put together three pertinent elements you should explore:
- Risks: Be aware that Sailun Group is showing 1 warning sign in our investment analysis , you should know about...
- Future Earnings: How does 601058's growth rate compare to its peers and the wider market? Dig deeper into the analyst consensus number for the upcoming years by interacting with our free analyst growth expectation chart.
- Other Solid Businesses: Low debt, high returns on equity and good past performance are fundamental to a strong business. Why not explore our interactive list of stocks with solid business fundamentals to see if there are other companies you may not have considered!
PS. Simply Wall St updates its DCF calculation for every Chinese stock every day, so if you want to find the intrinsic value of any other stock just search here.
New: Manage All Your Stock Portfolios in One Place
We've created the ultimate portfolio companion for stock investors, and it's free.
• Connect an unlimited number of Portfolios and see your total in one currency
• Be alerted to new Warning Signs or Risks via email or mobile
• Track the Fair Value of your stocks
Have feedback on this article? Concerned about the content? Get in touch with us directly. Alternatively, email editorial-team (at) simplywallst.com.
This article by Simply Wall St is general in nature. We provide commentary based on historical data and analyst forecasts only using an unbiased methodology and our articles are not intended to be financial advice. It does not constitute a recommendation to buy or sell any stock, and does not take account of your objectives, or your financial situation. We aim to bring you long-term focused analysis driven by fundamental data. Note that our analysis may not factor in the latest price-sensitive company announcements or qualitative material. Simply Wall St has no position in any stocks mentioned.
About SHSE:601058
Sailun Group
Engages in the research and development, production, sale, and servicing of tires in China, Europe, the United States, Asia, and Africa.
Very undervalued with outstanding track record and pays a dividend.
Market Insights


Advertisement
Community Narratives
Nike's Direct-to-Consumer Focus Will Drive Future Growth
Fair Value US$87.90|18.2% undervalued
UN
Community Contributor
Novo Nordisk will dominate GLP-1 market with Ozempic and Wegovy growth
Fair Value US$89.59|12.1% undervalued
BE
Community Contributor
Rheinmetall could get 20-25% of EU-NATO 3%-GDP defence spending
Fair Value €7.57k|82.4% undervalued
NO
Community Contributor