
Advertisement
Is Enaex S.A.'s (SNSE:ENAEX) Stock's Recent Performance Being Led By Its Attractive Financial Prospects?
Most readers would already be aware that Enaex's (SNSE:ENAEX) stock increased significantly by 21% over the past three months. Given the company's impressive performance, we decided to study its financial indicators more closely as a company's financial health over the long-term usually dictates market outcomes. Particularly, we will be paying attention to Enaex's ROE today.
Return on Equity or ROE is a test of how effectively a company is growing its value and managing investors’ money. In short, ROE shows the profit each dollar generates with respect to its shareholder investments.
View our latest analysis for Enaex
How To Calculate Return On Equity?
The formula for ROE is:
Return on Equity = Net Profit (from continuing operations) ÷ Shareholders' Equity
So, based on the above formula, the ROE for Enaex is:
19% = US$167m ÷ US$882m (Based on the trailing twelve months to December 2023).
The 'return' is the amount earned after tax over the last twelve months. So, this means that for every CLP1 of its shareholder's investments, the company generates a profit of CLP0.19.
Why Is ROE Important For Earnings Growth?
So far, we've learned that ROE is a measure of a company's profitability. We now need to evaluate how much profit the company reinvests or "retains" for future growth which then gives us an idea about the growth potential of the company. Assuming all else is equal, companies that have both a higher return on equity and higher profit retention are usually the ones that have a higher growth rate when compared to companies that don't have the same features.
A Side By Side comparison of Enaex's Earnings Growth And 19% ROE
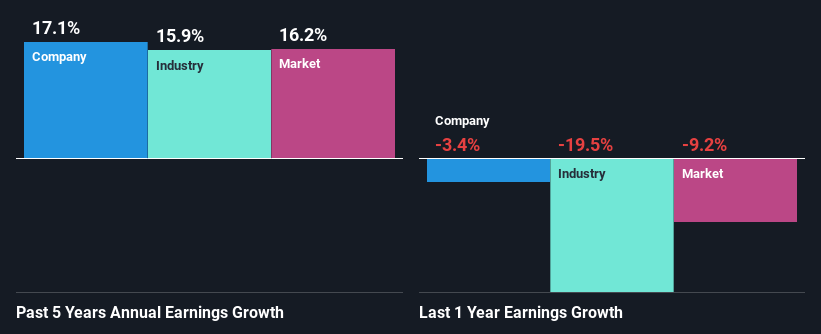
To begin with, Enaex seems to have a respectable ROE. Especially when compared to the industry average of 15% the company's ROE looks pretty impressive. Probably as a result of this, Enaex was able to see a decent growth of 17% over the last five years.
Next, on comparing Enaex's net income growth with the industry, we found that the company's reported growth is similar to the industry average growth rate of 16% over the last few years.
Earnings growth is a huge factor in stock valuation. It’s important for an investor to know whether the market has priced in the company's expected earnings growth (or decline). Doing so will help them establish if the stock's future looks promising or ominous. One good indicator of expected earnings growth is the P/E ratio which determines the price the market is willing to pay for a stock based on its earnings prospects. So, you may want to check if Enaex is trading on a high P/E or a low P/E, relative to its industry.
Is Enaex Using Its Retained Earnings Effectively?
The high three-year median payout ratio of 57% (or a retention ratio of 43%) for Enaex suggests that the company's growth wasn't really hampered despite it returning most of its income to its shareholders.
Besides, Enaex has been paying dividends over a period of nine years. This shows that the company is committed to sharing profits with its shareholders.
Summary
Overall, we are quite pleased with Enaex's performance. In particular, its high ROE is quite noteworthy and also the probable explanation behind its considerable earnings growth. Yet, the company is retaining a small portion of its profits. Which means that the company has been able to grow its earnings in spite of it, so that's not too bad. So far, we've only made a quick discussion around the company's earnings growth. You can do your own research on Enaex and see how it has performed in the past by looking at this FREE detailed graph of past earnings, revenue and cash flows.
Valuation is complex, but we're here to simplify it.
Discover if Enaex might be undervalued or overvalued with our detailed analysis, featuring fair value estimates, potential risks, dividends, insider trades, and its financial condition.
Access Free AnalysisHave feedback on this article? Concerned about the content? Get in touch with us directly. Alternatively, email editorial-team (at) simplywallst.com.
This article by Simply Wall St is general in nature. We provide commentary based on historical data and analyst forecasts only using an unbiased methodology and our articles are not intended to be financial advice. It does not constitute a recommendation to buy or sell any stock, and does not take account of your objectives, or your financial situation. We aim to bring you long-term focused analysis driven by fundamental data. Note that our analysis may not factor in the latest price-sensitive company announcements or qualitative material. Simply Wall St has no position in any stocks mentioned.
About SNSE:ENAEX
Enaex
Together its subsidiaries, engages in the production and sale of explosives in Chile and internationally.
Flawless balance sheet average dividend payer.
Market Insights

Advertisement
Community Narratives
Quality at a Premium. A time to watch, not to buy?
Fair Value US$154.56|30.1% undervalued
DA
Community Contributor
GRAB: The Super-App at the Heart of Southeast Asia’s Digital Boom
Fair Value US$8.20|25.6% undervalued
BL
Community Contributor
Verve Group to Surge with 51.61% Revenue Growth
Fair Value €6.00|63.2% undervalued
ME
Community Contributor