- Chile
- /
- Industrials
- /
- SNSE:QUINENCO
Should We Be Excited About The Trends Of Returns At Quiñenco (SNSE:QUINENCO)?


If we want to find a potential multi-bagger, often there are underlying trends that can provide clues. Ideally, a business will show two trends; firstly a growing return on capital employed (ROCE) and secondly, an increasing amount of capital employed. If you see this, it typically means it's a company with a great business model and plenty of profitable reinvestment opportunities. In light of that, when we looked at Quiñenco (SNSE:QUINENCO) and its ROCE trend, we weren't exactly thrilled.
Understanding Return On Capital Employed (ROCE)
Just to clarify if you're unsure, ROCE is a metric for evaluating how much pre-tax income (in percentage terms) a company earns on the capital invested in its business. The formula for this calculation on Quiñenco is:
Return on Capital Employed = Earnings Before Interest and Tax (EBIT) ÷ (Total Assets - Current Liabilities)
0.034 = CL$767b ÷ (CL$53t - CL$31t) (Based on the trailing twelve months to June 2020).
Thus, Quiñenco has an ROCE of 3.4%. In absolute terms, that's a low return and it also under-performs the Industrials industry average of 6.3%.
See our latest analysis for Quiñenco
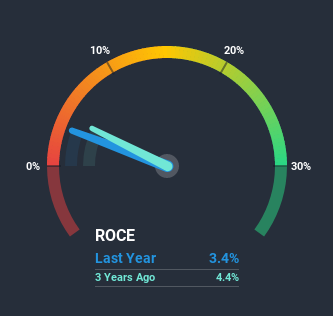
Historical performance is a great place to start when researching a stock so above you can see the gauge for Quiñenco's ROCE against it's prior returns. If you're interested in investigating Quiñenco's past further, check out this free graph of past earnings, revenue and cash flow.
The Trend Of ROCE
On the surface, the trend of ROCE at Quiñenco doesn't inspire confidence. Over the last five years, returns on capital have decreased to 3.4% from 4.7% five years ago. Meanwhile, the business is utilizing more capital but this hasn't moved the needle much in terms of sales in the past 12 months, so this could reflect longer term investments. It's worth keeping an eye on the company's earnings from here on to see if these investments do end up contributing to the bottom line.
Another thing to note, Quiñenco has a high ratio of current liabilities to total assets of 58%. This effectively means that suppliers (or short-term creditors) are funding a large portion of the business, so just be aware that this can introduce some elements of risk. Ideally we'd like to see this reduce as that would mean fewer obligations bearing risks.Our Take On Quiñenco's ROCE
In summary, Quiñenco is reinvesting funds back into the business for growth but unfortunately it looks like sales haven't increased much just yet. Additionally, the stock's total return to shareholders over the last five years has been flat, which isn't too surprising. Therefore based on the analysis done in this article, we don't think Quiñenco has the makings of a multi-bagger.
If you want to know some of the risks facing Quiñenco we've found 3 warning signs (1 is a bit concerning!) that you should be aware of before investing here.
While Quiñenco may not currently earn the highest returns, we've compiled a list of companies that currently earn more than 25% return on equity. Check out this free list here.
If you decide to trade Quiñenco, use the lowest-cost* platform that is rated #1 Overall by Barron’s, Interactive Brokers. Trade stocks, options, futures, forex, bonds and funds on 135 markets, all from a single integrated account. Promoted
If you're looking to trade Quiñenco, open an account with the lowest-cost platform trusted by professionals, Interactive Brokers.
With clients in over 200 countries and territories, and access to 160 markets, IBKR lets you trade stocks, options, futures, forex, bonds and funds from a single integrated account.
Enjoy no hidden fees, no account minimums, and FX conversion rates as low as 0.03%, far better than what most brokers offer.
Sponsored ContentValuation is complex, but we're here to simplify it.
Discover if Quiñenco might be undervalued or overvalued with our detailed analysis, featuring fair value estimates, potential risks, dividends, insider trades, and its financial condition.
Access Free AnalysisThis article by Simply Wall St is general in nature. It does not constitute a recommendation to buy or sell any stock, and does not take account of your objectives, or your financial situation. We aim to bring you long-term focused analysis driven by fundamental data. Note that our analysis may not factor in the latest price-sensitive company announcements or qualitative material. Simply Wall St has no position in any stocks mentioned.
*Interactive Brokers Rated Lowest Cost Broker by StockBrokers.com Annual Online Review 2020
Have feedback on this article? Concerned about the content? Get in touch with us directly. Alternatively, email editorial-team@simplywallst.com.
About SNSE:QUINENCO
Quiñenco
A business conglomerate, operates in the industrial and financial services sectors in Chile and internationally.
Adequate balance sheet slight.

