
Advertisement
- Switzerland
- /
- Semiconductors
- /
- SWX:AMS
ams-OSRAM (VTX:AMS) adds CHF84m to market cap in the past 7 days, though investors from five years ago are still down 77%

We're definitely into long term investing, but some companies are simply bad investments over any time frame. We don't wish catastrophic capital loss on anyone. Imagine if you held ams-OSRAM AG (VTX:AMS) for half a decade as the share price tanked 92%. And it's not just long term holders hurting, because the stock is down 75% in the last year. Furthermore, it's down 31% in about a quarter. That's not much fun for holders. We really hope anyone holding through that price crash has a diversified portfolio. Even when you lose money, you don't have to lose the lesson.
While the last five years has been tough for ams-OSRAM shareholders, this past week has shown signs of promise. So let's look at the longer term fundamentals and see if they've been the driver of the negative returns.
View our latest analysis for ams-OSRAM
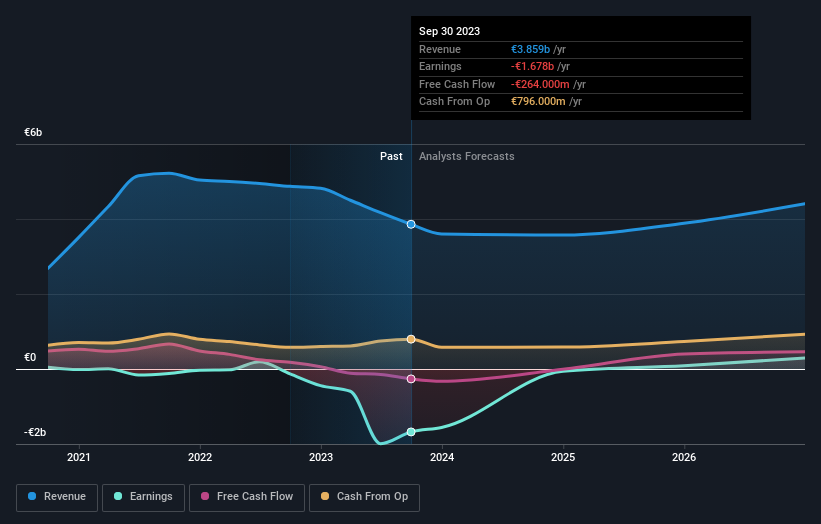
Given that ams-OSRAM didn't make a profit in the last twelve months, we'll focus on revenue growth to form a quick view of its business development. When a company doesn't make profits, we'd generally expect to see good revenue growth. Some companies are willing to postpone profitability to grow revenue faster, but in that case one does expect good top-line growth.
In the last half decade, ams-OSRAM saw its revenue increase by 24% per year. That's better than most loss-making companies. So it's not at all clear to us why the share price sunk 14% throughout that time. It could be that the stock was over-hyped before. We'd recommend carefully checking for indications of future growth - and balance sheet threats - before considering a purchase.
You can see how earnings and revenue have changed over time in the image below (click on the chart to see the exact values).
Balance sheet strength is crucial. It might be well worthwhile taking a look at our free report on how its financial position has changed over time.
What About The Total Shareholder Return (TSR)?
We've already covered ams-OSRAM's share price action, but we should also mention its total shareholder return (TSR). The TSR is a return calculation that accounts for the value of cash dividends (assuming that any dividend received was reinvested) and the calculated value of any discounted capital raisings and spin-offs. Its history of dividend payouts mean that ams-OSRAM's TSR, which was a 77% drop over the last 5 years, was not as bad as the share price return.
A Different Perspective
ams-OSRAM shareholders are down 53% for the year, but the market itself is up 1.6%. Even the share prices of good stocks drop sometimes, but we want to see improvements in the fundamental metrics of a business, before getting too interested. Regrettably, last year's performance caps off a bad run, with the shareholders facing a total loss of 12% per year over five years. Generally speaking long term share price weakness can be a bad sign, though contrarian investors might want to research the stock in hope of a turnaround. It's always interesting to track share price performance over the longer term. But to understand ams-OSRAM better, we need to consider many other factors. Case in point: We've spotted 2 warning signs for ams-OSRAM you should be aware of.
If you would prefer to check out another company -- one with potentially superior financials -- then do not miss this free list of companies that have proven they can grow earnings.
Please note, the market returns quoted in this article reflect the market weighted average returns of stocks that currently trade on Swiss exchanges.
New: AI Stock Screener & Alerts
Our new AI Stock Screener scans the market every day to uncover opportunities.
• Dividend Powerhouses (3%+ Yield)
• Undervalued Small Caps with Insider Buying
• High growth Tech and AI Companies
Or build your own from over 50 metrics.
Have feedback on this article? Concerned about the content? Get in touch with us directly. Alternatively, email editorial-team (at) simplywallst.com.
This article by Simply Wall St is general in nature. We provide commentary based on historical data and analyst forecasts only using an unbiased methodology and our articles are not intended to be financial advice. It does not constitute a recommendation to buy or sell any stock, and does not take account of your objectives, or your financial situation. We aim to bring you long-term focused analysis driven by fundamental data. Note that our analysis may not factor in the latest price-sensitive company announcements or qualitative material. Simply Wall St has no position in any stocks mentioned.
About SWX:AMS
ams-OSRAM
Engages in the design, manufacture, and sale of LED and optical sensor solutions in Europe, the Middle East, Africa, the Americas, and the Asia/Pacific.
Undervalued with reasonable growth potential.
Market Insights


Advertisement
Community Narratives
The Future of Drug Testing? Fingerprint Tech Shows Serious Promise
Fair Value US$2.98|43.0% undervalued
JO
Community Contributor
Suncorp’s Next Chapter: Insurance-Only and Ready to Grow
Fair Value AU$22.83|7.6% undervalued
RO
Community Contributor
Thyssenkrupp Nucera Will Achieve Double-Digit Profits by 2030 Boosted by Hydrogen Growth
Fair Value €14.40|30.6% undervalued
CH
Community Contributor
Tesla’s Nvidia Moment – The AI & Robotics Inflection Point
Fair Value US$359.72|18.3% undervalued
BL
Community Contributor