
Advertisement

The external fund manager backed by Berkshire Hathaway's Charlie Munger, Li Lu, makes no bones about it when he says 'The biggest investment risk is not the volatility of prices, but whether you will suffer a permanent loss of capital.' It's only natural to consider a company's balance sheet when you examine how risky it is, since debt is often involved when a business collapses. We note that Sika AG (VTX:SIKA) does have debt on its balance sheet. But the real question is whether this debt is making the company risky.
Why Does Debt Bring Risk?
Debt and other liabilities become risky for a business when it cannot easily fulfill those obligations, either with free cash flow or by raising capital at an attractive price. Part and parcel of capitalism is the process of 'creative destruction' where failed businesses are mercilessly liquidated by their bankers. However, a more usual (but still expensive) situation is where a company must dilute shareholders at a cheap share price simply to get debt under control. Having said that, the most common situation is where a company manages its debt reasonably well - and to its own advantage. When we examine debt levels, we first consider both cash and debt levels, together.
View our latest analysis for Sika
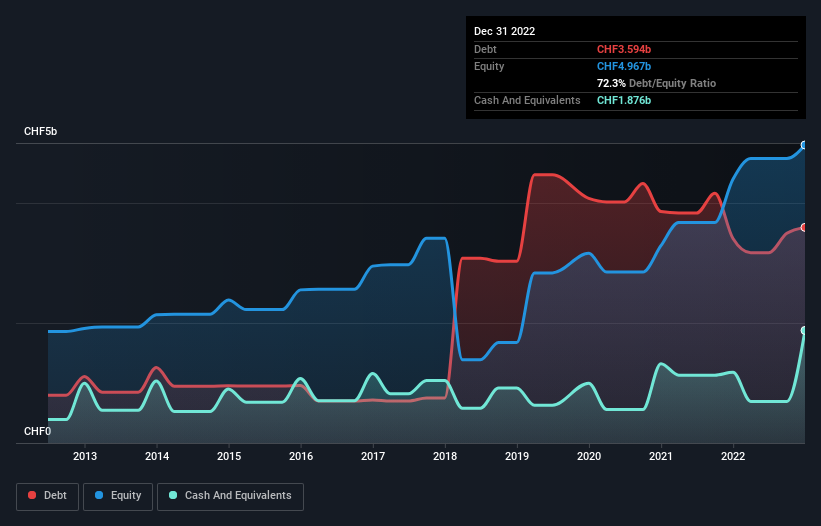
How Much Debt Does Sika Carry?
The image below, which you can click on for greater detail, shows that at December 2022 Sika had debt of CHF3.59b, up from CHF3.41b in one year. However, it also had CHF1.88b in cash, and so its net debt is CHF1.72b.
How Strong Is Sika's Balance Sheet?
We can see from the most recent balance sheet that Sika had liabilities of CHF2.04b falling due within a year, and liabilities of CHF4.31b due beyond that. Offsetting these obligations, it had cash of CHF1.88b as well as receivables valued at CHF1.74b due within 12 months. So it has liabilities totalling CHF2.74b more than its cash and near-term receivables, combined.
Given Sika has a humongous market capitalization of CHF37.0b, it's hard to believe these liabilities pose much threat. However, we do think it is worth keeping an eye on its balance sheet strength, as it may change over time.
In order to size up a company's debt relative to its earnings, we calculate its net debt divided by its earnings before interest, tax, depreciation, and amortization (EBITDA) and its earnings before interest and tax (EBIT) divided by its interest expense (its interest cover). The advantage of this approach is that we take into account both the absolute quantum of debt (with net debt to EBITDA) and the actual interest expenses associated with that debt (with its interest cover ratio).
Sika's net debt is only 0.97 times its EBITDA. And its EBIT covers its interest expense a whopping 38.8 times over. So you could argue it is no more threatened by its debt than an elephant is by a mouse. Fortunately, Sika grew its EBIT by 6.7% in the last year, making that debt load look even more manageable. When analysing debt levels, the balance sheet is the obvious place to start. But it is future earnings, more than anything, that will determine Sika's ability to maintain a healthy balance sheet going forward. So if you're focused on the future you can check out this free report showing analyst profit forecasts.
Finally, a company can only pay off debt with cold hard cash, not accounting profits. So the logical step is to look at the proportion of that EBIT that is matched by actual free cash flow. Over the most recent three years, Sika recorded free cash flow worth 74% of its EBIT, which is around normal, given free cash flow excludes interest and tax. This cold hard cash means it can reduce its debt when it wants to.
Our View
Sika's interest cover suggests it can handle its debt as easily as Cristiano Ronaldo could score a goal against an under 14's goalkeeper. And that's just the beginning of the good news since its conversion of EBIT to free cash flow is also very heartening. Zooming out, Sika seems to use debt quite reasonably; and that gets the nod from us. While debt does bring risk, when used wisely it can also bring a higher return on equity. Over time, share prices tend to follow earnings per share, so if you're interested in Sika, you may well want to click here to check an interactive graph of its earnings per share history.
When all is said and done, sometimes its easier to focus on companies that don't even need debt. Readers can access a list of growth stocks with zero net debt 100% free, right now.
New: Manage All Your Stock Portfolios in One Place
We've created the ultimate portfolio companion for stock investors, and it's free.
• Connect an unlimited number of Portfolios and see your total in one currency
• Be alerted to new Warning Signs or Risks via email or mobile
• Track the Fair Value of your stocks
Have feedback on this article? Concerned about the content? Get in touch with us directly. Alternatively, email editorial-team (at) simplywallst.com.
This article by Simply Wall St is general in nature. We provide commentary based on historical data and analyst forecasts only using an unbiased methodology and our articles are not intended to be financial advice. It does not constitute a recommendation to buy or sell any stock, and does not take account of your objectives, or your financial situation. We aim to bring you long-term focused analysis driven by fundamental data. Note that our analysis may not factor in the latest price-sensitive company announcements or qualitative material. Simply Wall St has no position in any stocks mentioned.
About SWX:SIKA
Sika
A specialty chemicals company, develops, produces, and sells systems and products for bonding, sealing, damping, reinforcing, and protecting in the building sector and motor vehicle industry worldwide.
Solid track record with adequate balance sheet.
Similar Companies
Market Insights

Advertisement
Community Narratives
Nike's Direct-to-Consumer Focus Will Drive Future Growth
Fair Value US$87.90|17.0% undervalued
UN
Community Contributor
Novo Nordisk will dominate GLP-1 market with Ozempic and Wegovy growth
Fair Value US$89.59|11.8% undervalued
BE
Community Contributor
Rheinmetall could get 20-25% of EU-NATO 3%-GDP defence spending
Fair Value €7.57k|82.4% undervalued
NO
Community Contributor