- Switzerland
- /
- Luxury
- /
- SWX:UHR
Here's What To Make Of Swatch Group's (VTX:UHR) Decelerating Rates Of Return


If we want to find a potential multi-bagger, often there are underlying trends that can provide clues. One common approach is to try and find a company with returns on capital employed (ROCE) that are increasing, in conjunction with a growing amount of capital employed. This shows us that it's a compounding machine, able to continually reinvest its earnings back into the business and generate higher returns. In light of that, when we looked at Swatch Group (VTX:UHR) and its ROCE trend, we weren't exactly thrilled.
Return On Capital Employed (ROCE): What Is It?
Just to clarify if you're unsure, ROCE is a metric for evaluating how much pre-tax income (in percentage terms) a company earns on the capital invested in its business. To calculate this metric for Swatch Group, this is the formula:
Return on Capital Employed = Earnings Before Interest and Tax (EBIT) ÷ (Total Assets - Current Liabilities)
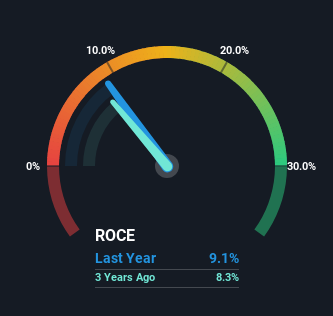
0.091 = CHF1.2b ÷ (CHF14b - CHF1.1b) (Based on the trailing twelve months to December 2022).
So, Swatch Group has an ROCE of 9.1%. Ultimately, that's a low return and it under-performs the Luxury industry average of 13%.
Check out our latest analysis for Swatch Group
In the above chart we have measured Swatch Group's prior ROCE against its prior performance, but the future is arguably more important. If you'd like to see what analysts are forecasting going forward, you should check out our free report for Swatch Group.
SWOT Analysis for Swatch Group
- Earnings growth over the past year exceeded its 5-year average.
- Debt is not viewed as a risk.
- Earnings growth over the past year underperformed the Luxury industry.
- Dividend is low compared to the top 25% of dividend payers in the Luxury market.
- Annual earnings are forecast to grow faster than the Swiss market.
- Good value based on P/E ratio and estimated fair value.
- Dividends are not covered by cash flow.
- Revenue is forecast to grow slower than 20% per year.
The Trend Of ROCE
There hasn't been much to report for Swatch Group's returns and its level of capital employed because both metrics have been steady for the past five years. It's not uncommon to see this when looking at a mature and stable business that isn't re-investing its earnings because it has likely passed that phase of the business cycle. So unless we see a substantial change at Swatch Group in terms of ROCE and additional investments being made, we wouldn't hold our breath on it being a multi-bagger. With fewer investment opportunities, it makes sense that Swatch Group has been paying out a decent 42% of its earnings to shareholders. Given the business isn't reinvesting in itself, it makes sense to distribute a portion of earnings among shareholders.
The Key Takeaway
In summary, Swatch Group isn't compounding its earnings but is generating stable returns on the same amount of capital employed. And investors appear hesitant that the trends will pick up because the stock has fallen 37% in the last five years. In any case, the stock doesn't have these traits of a multi-bagger discussed above, so if that's what you're looking for, we think you'd have more luck elsewhere.
On a final note, we've found 1 warning sign for Swatch Group that we think you should be aware of.
While Swatch Group may not currently earn the highest returns, we've compiled a list of companies that currently earn more than 25% return on equity. Check out this free list here.
New: Manage All Your Stock Portfolios in One Place
We've created the ultimate portfolio companion for stock investors, and it's free.
• Connect an unlimited number of Portfolios and see your total in one currency
• Be alerted to new Warning Signs or Risks via email or mobile
• Track the Fair Value of your stocks
Have feedback on this article? Concerned about the content? Get in touch with us directly. Alternatively, email editorial-team (at) simplywallst.com.
This article by Simply Wall St is general in nature. We provide commentary based on historical data and analyst forecasts only using an unbiased methodology and our articles are not intended to be financial advice. It does not constitute a recommendation to buy or sell any stock, and does not take account of your objectives, or your financial situation. We aim to bring you long-term focused analysis driven by fundamental data. Note that our analysis may not factor in the latest price-sensitive company announcements or qualitative material. Simply Wall St has no position in any stocks mentioned.
About SWX:UHR
Swatch Group
Designs, manufactures, and sells finished watches, jewelry, and watch movements and components worldwide.
Flawless balance sheet and good value.

