
Advertisement

Legendary fund manager Li Lu (who Charlie Munger backed) once said, 'The biggest investment risk is not the volatility of prices, but whether you will suffer a permanent loss of capital.' When we think about how risky a company is, we always like to look at its use of debt, since debt overload can lead to ruin. Importantly, SGS SA (VTX:SGSN) does carry debt. But the more important question is: how much risk is that debt creating?
What Risk Does Debt Bring?
Debt assists a business until the business has trouble paying it off, either with new capital or with free cash flow. If things get really bad, the lenders can take control of the business. However, a more usual (but still expensive) situation is where a company must dilute shareholders at a cheap share price simply to get debt under control. Having said that, the most common situation is where a company manages its debt reasonably well - and to its own advantage. The first thing to do when considering how much debt a business uses is to look at its cash and debt together.
How Much Debt Does SGS Carry?
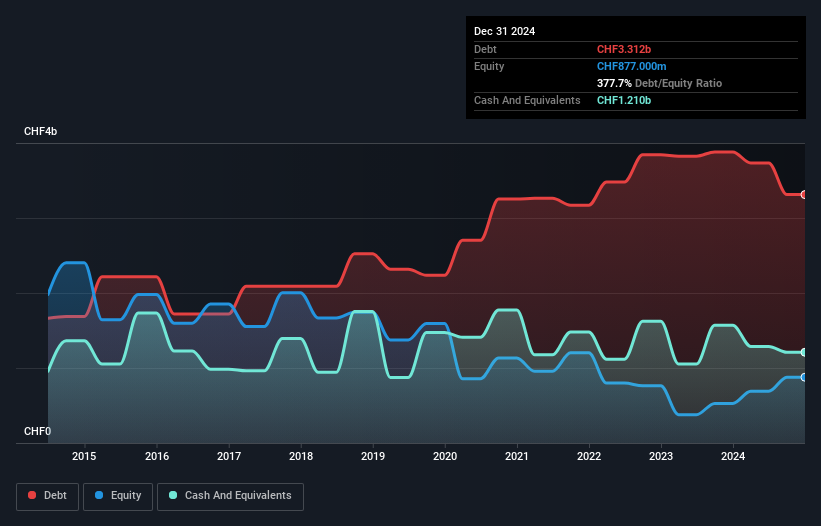
The image below, which you can click on for greater detail, shows that SGS had debt of CHF3.31b at the end of December 2024, a reduction from CHF3.88b over a year. However, it also had CHF1.21b in cash, and so its net debt is CHF2.10b.
How Strong Is SGS' Balance Sheet?
Zooming in on the latest balance sheet data, we can see that SGS had liabilities of CHF2.53b due within 12 months and liabilities of CHF3.35b due beyond that. Offsetting these obligations, it had cash of CHF1.21b as well as receivables valued at CHF1.56b due within 12 months. So its liabilities total CHF3.10b more than the combination of its cash and short-term receivables.
SGS has a very large market capitalization of CHF13.9b, so it could very likely raise cash to ameliorate its balance sheet, if the need arose. However, it is still worthwhile taking a close look at its ability to pay off debt.
View our latest analysis for SGS
We use two main ratios to inform us about debt levels relative to earnings. The first is net debt divided by earnings before interest, tax, depreciation, and amortization (EBITDA), while the second is how many times its earnings before interest and tax (EBIT) covers its interest expense (or its interest cover, for short). The advantage of this approach is that we take into account both the absolute quantum of debt (with net debt to EBITDA) and the actual interest expenses associated with that debt (with its interest cover ratio).
SGS's net debt to EBITDA ratio of about 1.8 suggests only moderate use of debt. And its strong interest cover of 20.0 times, makes us even more comfortable. Notably SGS's EBIT was pretty flat over the last year. We would prefer to see some earnings growth, because that always helps diminish debt. There's no doubt that we learn most about debt from the balance sheet. But ultimately the future profitability of the business will decide if SGS can strengthen its balance sheet over time. So if you're focused on the future you can check out this free report showing analyst profit forecasts .
Finally, while the tax-man may adore accounting profits, lenders only accept cold hard cash. So the logical step is to look at the proportion of that EBIT that is matched by actual free cash flow. During the last three years, SGS generated free cash flow amounting to a very robust 91% of its EBIT, more than we'd expect. That puts it in a very strong position to pay down debt.
Our View
Happily, SGS's impressive interest cover implies it has the upper hand on its debt. And the good news does not stop there, as its conversion of EBIT to free cash flow also supports that impression! When we consider the range of factors above, it looks like SGS is pretty sensible with its use of debt. That means they are taking on a bit more risk, in the hope of boosting shareholder returns. When analysing debt levels, the balance sheet is the obvious place to start. However, not all investment risk resides within the balance sheet - far from it. For example - SGS has 2 warning signs we think you should be aware of.
When all is said and done, sometimes its easier to focus on companies that don't even need debt. Readers can access a list of growth stocks with zero net debt 100% free, right now.
New: Manage All Your Stock Portfolios in One Place
We've created the ultimate portfolio companion for stock investors, and it's free.
• Connect an unlimited number of Portfolios and see your total in one currency
• Be alerted to new Warning Signs or Risks via email or mobile
• Track the Fair Value of your stocks
Have feedback on this article? Concerned about the content? Get in touch with us directly. Alternatively, email editorial-team (at) simplywallst.com.
This article by Simply Wall St is general in nature. We provide commentary based on historical data and analyst forecasts only using an unbiased methodology and our articles are not intended to be financial advice. It does not constitute a recommendation to buy or sell any stock, and does not take account of your objectives, or your financial situation. We aim to bring you long-term focused analysis driven by fundamental data. Note that our analysis may not factor in the latest price-sensitive company announcements or qualitative material. Simply Wall St has no position in any stocks mentioned.
About SWX:SGSN
SGS
Provides inspection, testing, and certification services in Europe, Africa, the Middle East, Latin America, North America, and the Asia Pacific.
Solid track record average dividend payer.
Similar Companies
Market Insights


Advertisement
Community Narratives
SSAB in pole position when it comes to the combination of steel tariffs and the EU's investment drive
Fair Value SEK 98.20|44.1% undervalued
PI
Community Contributor
The Future of Lennar and Homebuilding Faces Short Term Challenges with Potential for Long Term Growth
Fair Value US$162.49|36.6% undervalued
ZE
Community Contributor
Saudi Aramco (SASE:2222): Not The Sexiest High Dividend Yield Stock, But One With Interesting 'Convertible-Like' Qualities
Fair Value ر.س37.02|31.4% undervalued
EV
Community Contributor