

There are a few key trends to look for if we want to identify the next multi-bagger. Firstly, we'd want to identify a growing return on capital employed (ROCE) and then alongside that, an ever-increasing base of capital employed. Basically this means that a company has profitable initiatives that it can continue to reinvest in, which is a trait of a compounding machine. So while SGS (VTX:SGSN) has a high ROCE right now, lets see what we can decipher from how returns are changing.
What Is Return On Capital Employed (ROCE)?
Just to clarify if you're unsure, ROCE is a metric for evaluating how much pre-tax income (in percentage terms) a company earns on the capital invested in its business. The formula for this calculation on SGS is:
Return on Capital Employed = Earnings Before Interest and Tax (EBIT) ÷ (Total Assets - Current Liabilities)
0.25 = CHF904m ÷ (CHF6.6b - CHF3.0b) (Based on the trailing twelve months to June 2023).
Thus, SGS has an ROCE of 25%. That's a fantastic return and not only that, it outpaces the average of 13% earned by companies in a similar industry.
Check out our latest analysis for SGS
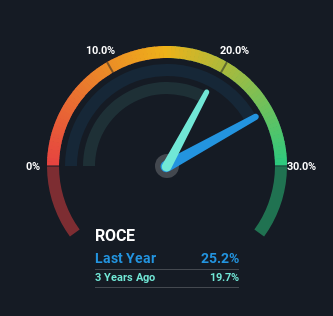
Above you can see how the current ROCE for SGS compares to its prior returns on capital, but there's only so much you can tell from the past. If you'd like to see what analysts are forecasting going forward, you should check out our free report for SGS.
So How Is SGS' ROCE Trending?
Things have been pretty stable at SGS, with its capital employed and returns on that capital staying somewhat the same for the last five years. Businesses with these traits tend to be mature and steady operations because they're past the growth phase. So while the current operations are delivering respectable returns, unless capital employed increases we'd be hard-pressed to believe it's a multi-bagger going forward. That probably explains why SGS has been paying out 81% of its earnings as dividends to shareholders. If the company is in fact lacking growth opportunities, that's one of the viable alternatives for the money.
On another note, while the change in ROCE trend might not scream for attention, it's interesting that the current liabilities have actually gone up over the last five years. This is intriguing because if current liabilities hadn't increased to 46% of total assets, this reported ROCE would probably be less than25% because total capital employed would be higher.The 25% ROCE could be even lower if current liabilities weren't 46% of total assets, because the the formula would show a larger base of total capital employed. Additionally, this high level of current liabilities isn't ideal because it means the company's suppliers (or short-term creditors) are effectively funding a large portion of the business.
The Bottom Line
While SGS has impressive profitability from its capital, it isn't increasing that amount of capital. Additionally, the stock's total return to shareholders over the last five years has been flat, which isn't too surprising. All in all, the inherent trends aren't typical of multi-baggers, so if that's what you're after, we think you might have more luck elsewhere.
One more thing, we've spotted 2 warning signs facing SGS that you might find interesting.
If you want to search for more stocks that have been earning high returns, check out this free list of stocks with solid balance sheets that are also earning high returns on equity.
New: Manage All Your Stock Portfolios in One Place
We've created the ultimate portfolio companion for stock investors, and it's free.
• Connect an unlimited number of Portfolios and see your total in one currency
• Be alerted to new Warning Signs or Risks via email or mobile
• Track the Fair Value of your stocks
Have feedback on this article? Concerned about the content? Get in touch with us directly. Alternatively, email editorial-team (at) simplywallst.com.
This article by Simply Wall St is general in nature. We provide commentary based on historical data and analyst forecasts only using an unbiased methodology and our articles are not intended to be financial advice. It does not constitute a recommendation to buy or sell any stock, and does not take account of your objectives, or your financial situation. We aim to bring you long-term focused analysis driven by fundamental data. Note that our analysis may not factor in the latest price-sensitive company announcements or qualitative material. Simply Wall St has no position in any stocks mentioned.
About SWX:SGSN
SGS
Provides inspection, testing, and verification services in Europe, Africa, the Middle East, the Americas, and the Asia Pacific.
Reasonable growth potential average dividend payer.

