
Advertisement
Legendary fund manager Li Lu (who Charlie Munger backed) once said, 'The biggest investment risk is not the volatility of prices, but whether you will suffer a permanent loss of capital.' So it seems the smart money knows that debt - which is usually involved in bankruptcies - is a very important factor, when you assess how risky a company is. Importantly, Emera Incorporated (TSE:EMA) does carry debt. But the real question is whether this debt is making the company risky.
Why Does Debt Bring Risk?
Generally speaking, debt only becomes a real problem when a company can't easily pay it off, either by raising capital or with its own cash flow. Ultimately, if the company can't fulfill its legal obligations to repay debt, shareholders could walk away with nothing. However, a more frequent (but still costly) occurrence is where a company must issue shares at bargain-basement prices, permanently diluting shareholders, just to shore up its balance sheet. Of course, debt can be an important tool in businesses, particularly capital heavy businesses. The first step when considering a company's debt levels is to consider its cash and debt together.
View our latest analysis for Emera
What Is Emera's Debt?
You can click the graphic below for the historical numbers, but it shows that Emera had CA$15.4b of debt in March 2021, down from CA$17.0b, one year before. And it doesn't have much cash, so its net debt is about the same.
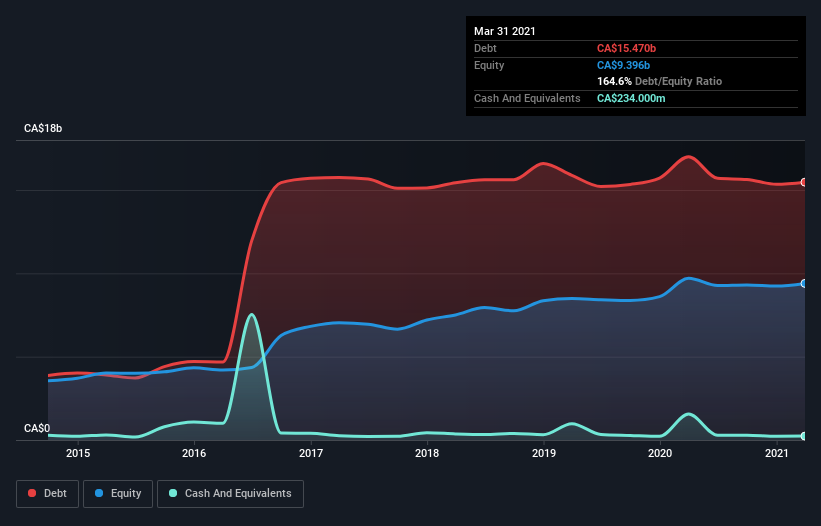
How Healthy Is Emera's Balance Sheet?
The latest balance sheet data shows that Emera had liabilities of CA$3.89b due within a year, and liabilities of CA$18.1b falling due after that. On the other hand, it had cash of CA$234.0m and CA$874.0m worth of receivables due within a year. So its liabilities outweigh the sum of its cash and (near-term) receivables by CA$20.9b.
Given this deficit is actually higher than the company's massive market capitalization of CA$14.3b, we think shareholders really should watch Emera's debt levels, like a parent watching their child ride a bike for the first time. In the scenario where the company had to clean up its balance sheet quickly, it seems likely shareholders would suffer extensive dilution.
We use two main ratios to inform us about debt levels relative to earnings. The first is net debt divided by earnings before interest, tax, depreciation, and amortization (EBITDA), while the second is how many times its earnings before interest and tax (EBIT) covers its interest expense (or its interest cover, for short). This way, we consider both the absolute quantum of the debt, as well as the interest rates paid on it.
Emera shareholders face the double whammy of a high net debt to EBITDA ratio (7.3), and fairly weak interest coverage, since EBIT is just 1.8 times the interest expense. The debt burden here is substantial. Even more troubling is the fact that Emera actually let its EBIT decrease by 4.8% over the last year. If that earnings trend continues the company will face an uphill battle to pay off its debt. There's no doubt that we learn most about debt from the balance sheet. But ultimately the future profitability of the business will decide if Emera can strengthen its balance sheet over time. So if you want to see what the professionals think, you might find this free report on analyst profit forecasts to be interesting.
Finally, a company can only pay off debt with cold hard cash, not accounting profits. So the logical step is to look at the proportion of that EBIT that is matched by actual free cash flow. Over the last three years, Emera saw substantial negative free cash flow, in total. While investors are no doubt expecting a reversal of that situation in due course, it clearly does mean its use of debt is more risky.
Our View
On the face of it, Emera's net debt to EBITDA left us tentative about the stock, and its conversion of EBIT to free cash flow was no more enticing than the one empty restaurant on the busiest night of the year. And even its interest cover fails to inspire much confidence. We should also note that Electric Utilities industry companies like Emera commonly do use debt without problems. After considering the datapoints discussed, we think Emera has too much debt. While some investors love that sort of risky play, it's certainly not our cup of tea. There's no doubt that we learn most about debt from the balance sheet. However, not all investment risk resides within the balance sheet - far from it. Be aware that Emera is showing 4 warning signs in our investment analysis , and 1 of those is concerning...
At the end of the day, it's often better to focus on companies that are free from net debt. You can access our special list of such companies (all with a track record of profit growth). It's free.
If you're looking for stocks to buy, use the lowest-cost* platform that is rated #1 Overall by Barron’s, Interactive Brokers. Trade stocks, options, futures, forex, bonds and funds on 135 markets, all from a single integrated account. Promoted
Valuation is complex, but we're here to simplify it.
Discover if Emera might be undervalued or overvalued with our detailed analysis, featuring fair value estimates, potential risks, dividends, insider trades, and its financial condition.
Access Free AnalysisThis article by Simply Wall St is general in nature. It does not constitute a recommendation to buy or sell any stock, and does not take account of your objectives, or your financial situation. We aim to bring you long-term focused analysis driven by fundamental data. Note that our analysis may not factor in the latest price-sensitive company announcements or qualitative material. Simply Wall St has no position in any stocks mentioned.
*Interactive Brokers Rated Lowest Cost Broker by StockBrokers.com Annual Online Review 2020
Have feedback on this article? Concerned about the content? Get in touch with us directly. Alternatively, email editorial-team (at) simplywallst.com.
About TSX:EMA
Emera
An energy and services company, invests in generation, transmission, and distribution of electricity in the United States, Canada, Barbados, and the Bahamas.
Proven track record second-rate dividend payer.
Similar Companies
Market Insights

Advertisement
Community Narratives
Quality at a Premium. A time to watch, not to buy?
Fair Value US$154.56|29.9% undervalued
DA
Community Contributor
GRAB: The Super-App at the Heart of Southeast Asia’s Digital Boom
Fair Value US$8.20|22.9% undervalued
BL
Community Contributor
Verve Group to Surge with 51.61% Revenue Growth
Fair Value €6.00|64.1% undervalued
ME
Community Contributor