Stock Analysis
- Canada
- /
- Transportation
- /
- TSX:MTL
Mullen Group's (TSE:MTL) three-year earnings growth trails the 16% YoY shareholder returns


One simple way to benefit from the stock market is to buy an index fund. But if you choose individual stocks with prowess, you can make superior returns. For example, Mullen Group Ltd. (TSE:MTL) shareholders have seen the share price rise 35% over three years, well in excess of the market return (16%, not including dividends). On the other hand, the returns haven't been quite so good recently, with shareholders up just 12% , including dividends .
On the back of a solid 7-day performance, let's check what role the company's fundamentals have played in driving long term shareholder returns.
Check out our latest analysis for Mullen Group
While markets are a powerful pricing mechanism, share prices reflect investor sentiment, not just underlying business performance. One flawed but reasonable way to assess how sentiment around a company has changed is to compare the earnings per share (EPS) with the share price.
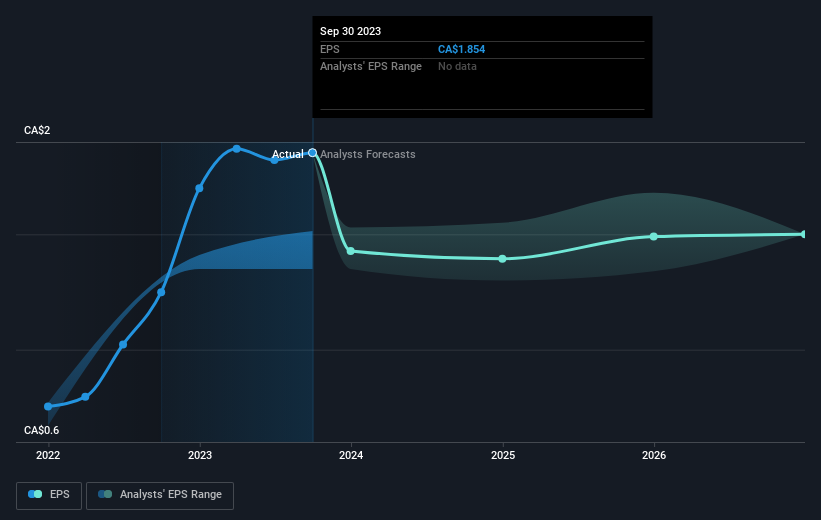
During three years of share price growth, Mullen Group achieved compound earnings per share growth of 47% per year. This EPS growth is higher than the 11% average annual increase in the share price. So one could reasonably conclude that the market has cooled on the stock. We'd venture the lowish P/E ratio of 7.86 also reflects the negative sentiment around the stock.
The image below shows how EPS has tracked over time (if you click on the image you can see greater detail).
It's good to see that there was some significant insider buying in the last three months. That's a positive. That said, we think earnings and revenue growth trends are even more important factors to consider. This free interactive report on Mullen Group's earnings, revenue and cash flow is a great place to start, if you want to investigate the stock further.
What About Dividends?
It is important to consider the total shareholder return, as well as the share price return, for any given stock. The TSR incorporates the value of any spin-offs or discounted capital raisings, along with any dividends, based on the assumption that the dividends are reinvested. It's fair to say that the TSR gives a more complete picture for stocks that pay a dividend. In the case of Mullen Group, it has a TSR of 56% for the last 3 years. That exceeds its share price return that we previously mentioned. This is largely a result of its dividend payments!
A Different Perspective
We're pleased to report that Mullen Group shareholders have received a total shareholder return of 12% over one year. That's including the dividend. Since the one-year TSR is better than the five-year TSR (the latter coming in at 10% per year), it would seem that the stock's performance has improved in recent times. In the best case scenario, this may hint at some real business momentum, implying that now could be a great time to delve deeper. It's always interesting to track share price performance over the longer term. But to understand Mullen Group better, we need to consider many other factors. Even so, be aware that Mullen Group is showing 3 warning signs in our investment analysis , and 1 of those doesn't sit too well with us...
Mullen Group is not the only stock insiders are buying. So take a peek at this free list of growing companies with insider buying.
Please note, the market returns quoted in this article reflect the market weighted average returns of stocks that currently trade on Canadian exchanges.
New: Manage All Your Stock Portfolios in One Place
We've created the ultimate portfolio companion for stock investors, and it's free.
• Connect an unlimited number of Portfolios and see your total in one currency
• Be alerted to new Warning Signs or Risks via email or mobile
• Track the Fair Value of your stocks
Have feedback on this article? Concerned about the content? Get in touch with us directly. Alternatively, email editorial-team (at) simplywallst.com.
This article by Simply Wall St is general in nature. We provide commentary based on historical data and analyst forecasts only using an unbiased methodology and our articles are not intended to be financial advice. It does not constitute a recommendation to buy or sell any stock, and does not take account of your objectives, or your financial situation. We aim to bring you long-term focused analysis driven by fundamental data. Note that our analysis may not factor in the latest price-sensitive company announcements or qualitative material. Simply Wall St has no position in any stocks mentioned.
About TSX:MTL
Mullen Group
Provides a range of trucking and logistics services in Canada and the United States.
Very undervalued second-rate dividend payer.
