
Advertisement
Firan Technology Group's (TSE:FTG) Earnings Are Of Questionable Quality
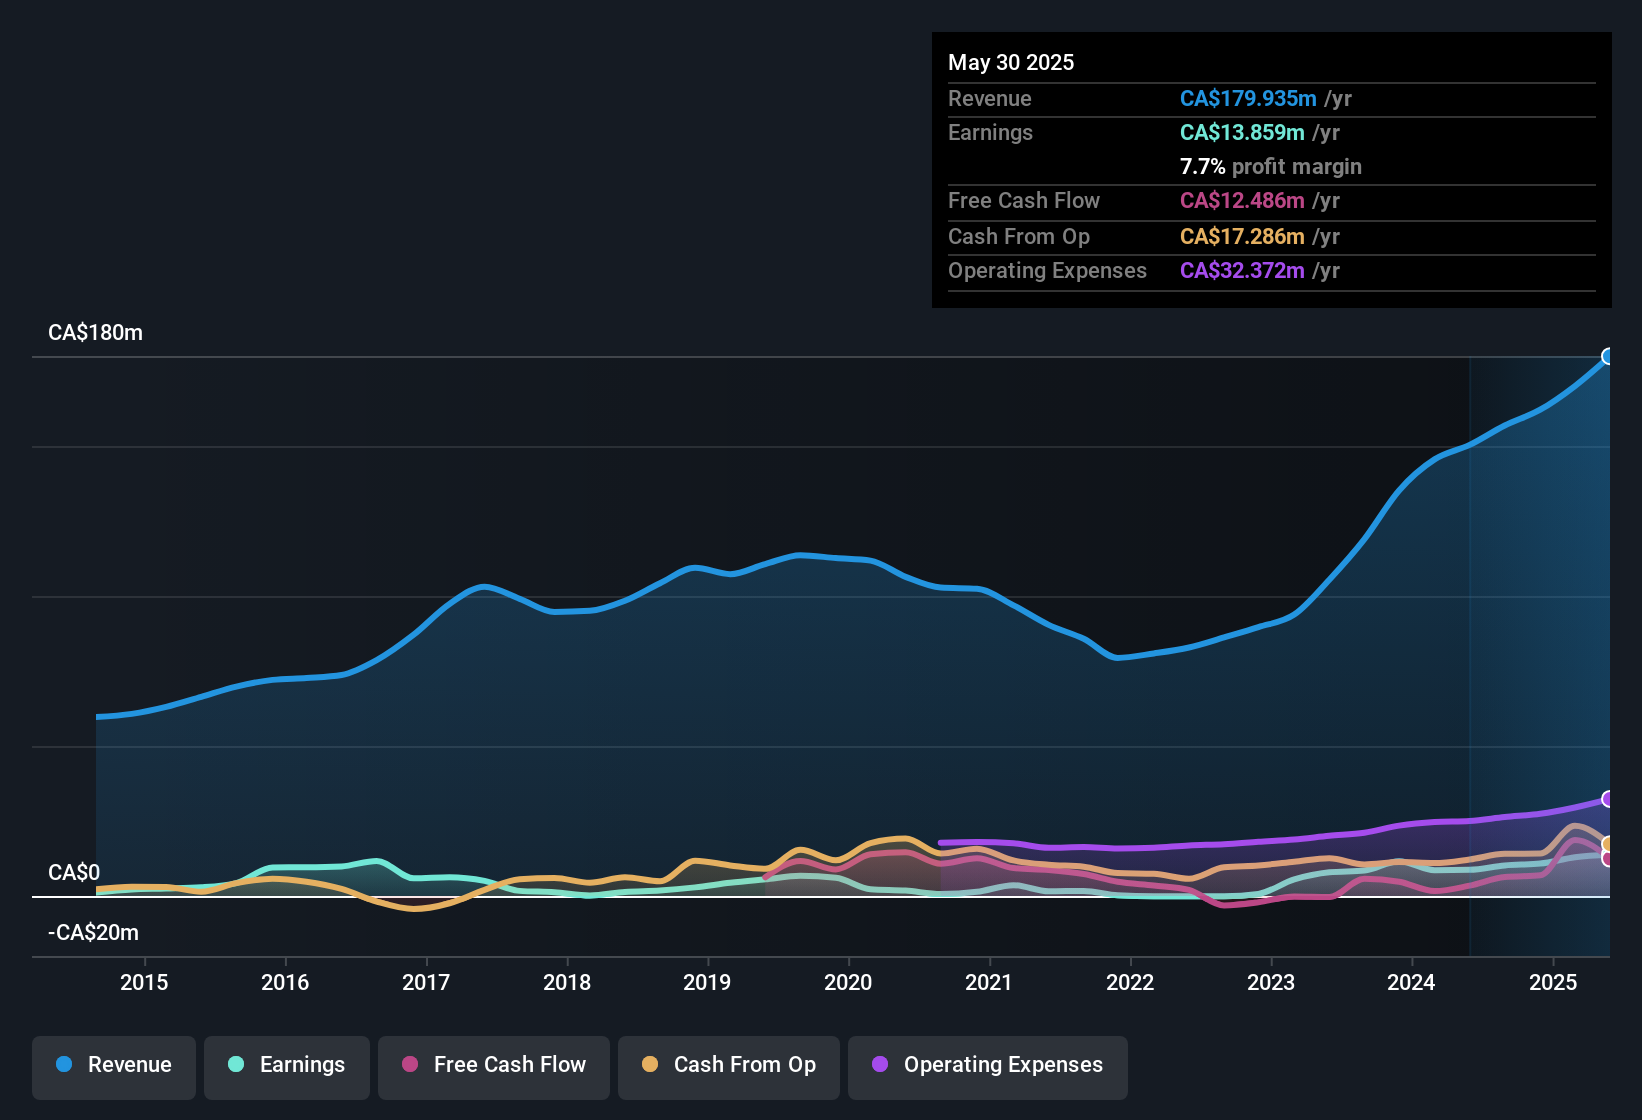
Firan Technology Group Corporation (TSE:FTG) announced strong profits, but the stock was stagnant. Our analysis suggests that this might be because shareholders have noticed some concerning underlying factors.
To understand the value of a company's earnings growth, it is imperative to consider any dilution of shareholders' interests. In fact, Firan Technology Group increased the number of shares on issue by 5.4% over the last twelve months by issuing new shares. That means its earnings are split among a greater number of shares. To talk about net income, without noticing earnings per share, is to be distracted by the big numbers while ignoring the smaller numbers that talk to per share value. You can see a chart of Firan Technology Group's EPS by clicking here.
A Look At The Impact Of Firan Technology Group's Dilution On Its Earnings Per Share (EPS)
Firan Technology Group was losing money three years ago. The good news is that profit was up 58% in the last twelve months. On the other hand, earnings per share are only up 55% over the same period. And so, you can see quite clearly that dilution is influencing shareholder earnings.
In the long term, earnings per share growth should beget share price growth. So Firan Technology Group shareholders will want to see that EPS figure continue to increase. However, if its profit increases while its earnings per share stay flat (or even fall) then shareholders might not see much benefit. For the ordinary retail shareholder, EPS is a great measure to check your hypothetical "share" of the company's profit.
That might leave you wondering what analysts are forecasting in terms of future profitability. Luckily, you can click here to see an interactive graph depicting future profitability, based on their estimates.
Our Take On Firan Technology Group's Profit Performance
Each Firan Technology Group share now gets a meaningfully smaller slice of its overall profit, due to dilution of existing shareholders. Therefore, it seems possible to us that Firan Technology Group's true underlying earnings power is actually less than its statutory profit. But at least holders can take some solace from the 55% EPS growth in the last year. At the end of the day, it's essential to consider more than just the factors above, if you want to understand the company properly. Obviously, we love to consider the historical data to inform our opinion of a company. But it can be really valuable to consider what other analysts are forecasting. So feel free to check out our free graph representing analyst forecasts.
This note has only looked at a single factor that sheds light on the nature of Firan Technology Group's profit. But there are plenty of other ways to inform your opinion of a company. Some people consider a high return on equity to be a good sign of a quality business. While it might take a little research on your behalf, you may find this free collection of companies boasting high return on equity, or this list of stocks with significant insider holdings to be useful.
New: AI Stock Screener & Alerts
Our new AI Stock Screener scans the market every day to uncover opportunities.
• Dividend Powerhouses (3%+ Yield)
• Undervalued Small Caps with Insider Buying
• High growth Tech and AI Companies
Or build your own from over 50 metrics.
Have feedback on this article? Concerned about the content? Get in touch with us directly. Alternatively, email editorial-team (at) simplywallst.com.
This article by Simply Wall St is general in nature. We provide commentary based on historical data and analyst forecasts only using an unbiased methodology and our articles are not intended to be financial advice. It does not constitute a recommendation to buy or sell any stock, and does not take account of your objectives, or your financial situation. We aim to bring you long-term focused analysis driven by fundamental data. Note that our analysis may not factor in the latest price-sensitive company announcements or qualitative material. Simply Wall St has no position in any stocks mentioned.
About TSX:FTG
Firan Technology Group
Manufactures and sells aerospace and defense electronic products and subsystems in Canada, the United States, and China.
Very undervalued with excellent balance sheet.
Market Insights

Advertisement
Weekly Picks
FA

FAI on Arabian Internet and Communication Services ·
Solutions by stc: 34% Upside in Saudi's Digital Transformation Leader
Fair Value:ر.س342.2335.3% undervalued
9 followersusers have followed this narrative
1 commentusers have commented on this narrative
3 likesusers have liked this narrative
RO


RobertoAllende on NVIDIA ·
The AI Infrastructure Giant Grows Into Its Valuation
Fair Value:US$345.0747.9% undervalued
27 followersusers have followed this narrative
28 commentsusers have commented on this narrative
21 likesusers have liked this narrative
Recently Updated Narratives
HA

Haha94 on Perdana Petroleum Berhad ·
Perdana Petroleum Berhad is a Zombie Business with a 27.34% Profit Margin and inflation adjusted revenue Business
Fair Value:RM 0.2128.6% undervalued
1 followerusers have followed this narrative
0 commentsusers have commented on this narrative
0 likesusers have liked this narrative
AB
Abc on Global X Etfs Icav - Global X Silver Miners Ucits ETF ·
Many trends acting at the same time
Fair Value:€10068.5% undervalued
1 followerusers have followed this narrative
0 commentsusers have commented on this narrative
0 likesusers have liked this narrative
NI


niteco on Texas Instruments ·
Engineered for Stability. Positioned for Growth.
Fair Value:US$314.4446.5% undervalued
2 followersusers have followed this narrative
0 commentsusers have commented on this narrative
0 likesusers have liked this narrative
Popular Narratives
TH

TheWallstreetKing on MicroVision ·
MicroVision will explode future revenue by 380.37% with a vision towards success
Fair Value:US$6098.6% undervalued
109 followersusers have followed this narrative
11 commentsusers have commented on this narrative
22 likesusers have liked this narrative
AN

AnalystConsensusTarget on NVIDIA ·
NVDA: Expanding AI Demand Will Drive Major Data Center Investments Through 2026
Fair Value:US$250.3928.1% undervalued
941 followersusers have followed this narrative
6 commentsusers have commented on this narrative
24 likesusers have liked this narrative
OS


oscargarcia on Alphabet ·
The company that turned a verb into a global necessity and basically runs the modern internet, digital ads, smartphones, maps, and AI.
Fair Value:US$3407.4% undervalued
145 followersusers have followed this narrative
6 commentsusers have commented on this narrative
18 likesusers have liked this narrative