Advertisement
TSX Value Stocks Celestica And 2 Others That May Be Trading Below Estimated Worth

Simply Wall St
Reviewed by Simply Wall St
As trade tensions ease and central banks maintain a cautious stance on interest rates, the Canadian market is navigating a period of potential economic stabilization. In this environment, identifying stocks that may be trading below their estimated worth could offer investors opportunities for value investing.
Top 10 Undervalued Stocks Based On Cash Flows In Canada
| Name | Current Price | Fair Value (Est) | Discount (Est) |
| K92 Mining (TSX:KNT) | CA$12.65 | CA$23.80 | 46.8% |
| Docebo (TSX:DCBO) | CA$36.20 | CA$58.03 | 37.6% |
| Badger Infrastructure Solutions (TSX:BDGI) | CA$43.70 | CA$77.07 | 43.3% |
| Groupe Dynamite (TSX:GRGD) | CA$14.98 | CA$28.25 | 47% |
| Aris Mining (TSX:ARIS) | CA$7.84 | CA$13.12 | 40.2% |
| VersaBank (TSX:VBNK) | CA$15.79 | CA$30.62 | 48.4% |
| Lithium Royalty (TSX:LIRC) | CA$5.10 | CA$8.55 | 40.3% |
| Tidewater Midstream and Infrastructure (TSX:TWM) | CA$0.205 | CA$0.38 | 45.8% |
| AtkinsRéalis Group (TSX:ATRL) | CA$74.40 | CA$114.93 | 35.3% |
| Journey Energy (TSX:JOY) | CA$1.62 | CA$3.17 | 48.9% |
Let's take a closer look at a couple of our picks from the screened companies.
Celestica (TSX:CLS)
Overview: Celestica Inc., along with its subsidiaries, offers supply chain solutions across North America, Europe, and Asia with a market cap of CA$14.91 billion.
Operations: The company's revenue segments include Advanced Technology Solutions (ATS) generating $3.19 billion and Connectivity & Cloud Solutions (CCS) contributing $6.89 billion.
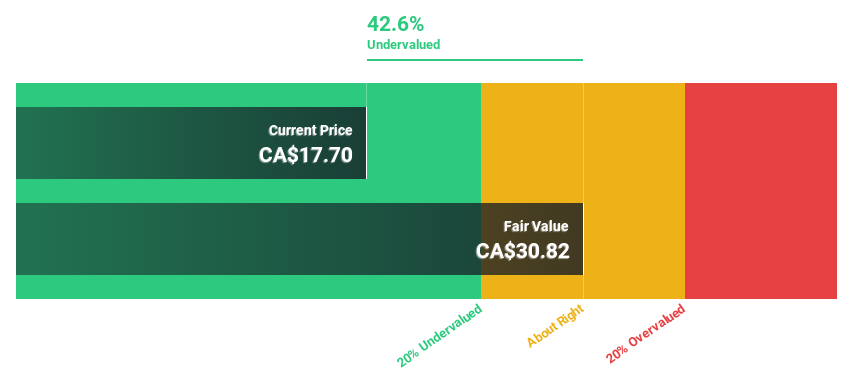
Estimated Discount To Fair Value: 21.9%
Celestica is trading at CA$140.33, which is 21.9% below its estimated fair value of CA$179.67, indicating it may be undervalued based on cash flows. Earnings are expected to grow significantly at 23.47% annually over the next three years, outpacing the Canadian market's growth rate of 13.7%. Despite a slight decline in net income for Q1 2025 compared to last year, revenue rose to US$2.65 billion from US$2.21 billion previously reported.
- According our earnings growth report, there's an indication that Celestica might be ready to expand.
- Click here and access our complete balance sheet health report to understand the dynamics of Celestica.
Energy Fuels (TSX:EFR)
Overview: Energy Fuels Inc. is involved in the exploration, recovery, recycling, operation, development, permitting, evaluation, and sale of uranium mineral properties in the United States with a market cap of CA$1.44 billion.
Operations: Energy Fuels Inc. generates revenue through activities related to the exploration, recovery, recycling, operation, development, permitting, evaluation, and sale of uranium mineral properties in the United States.
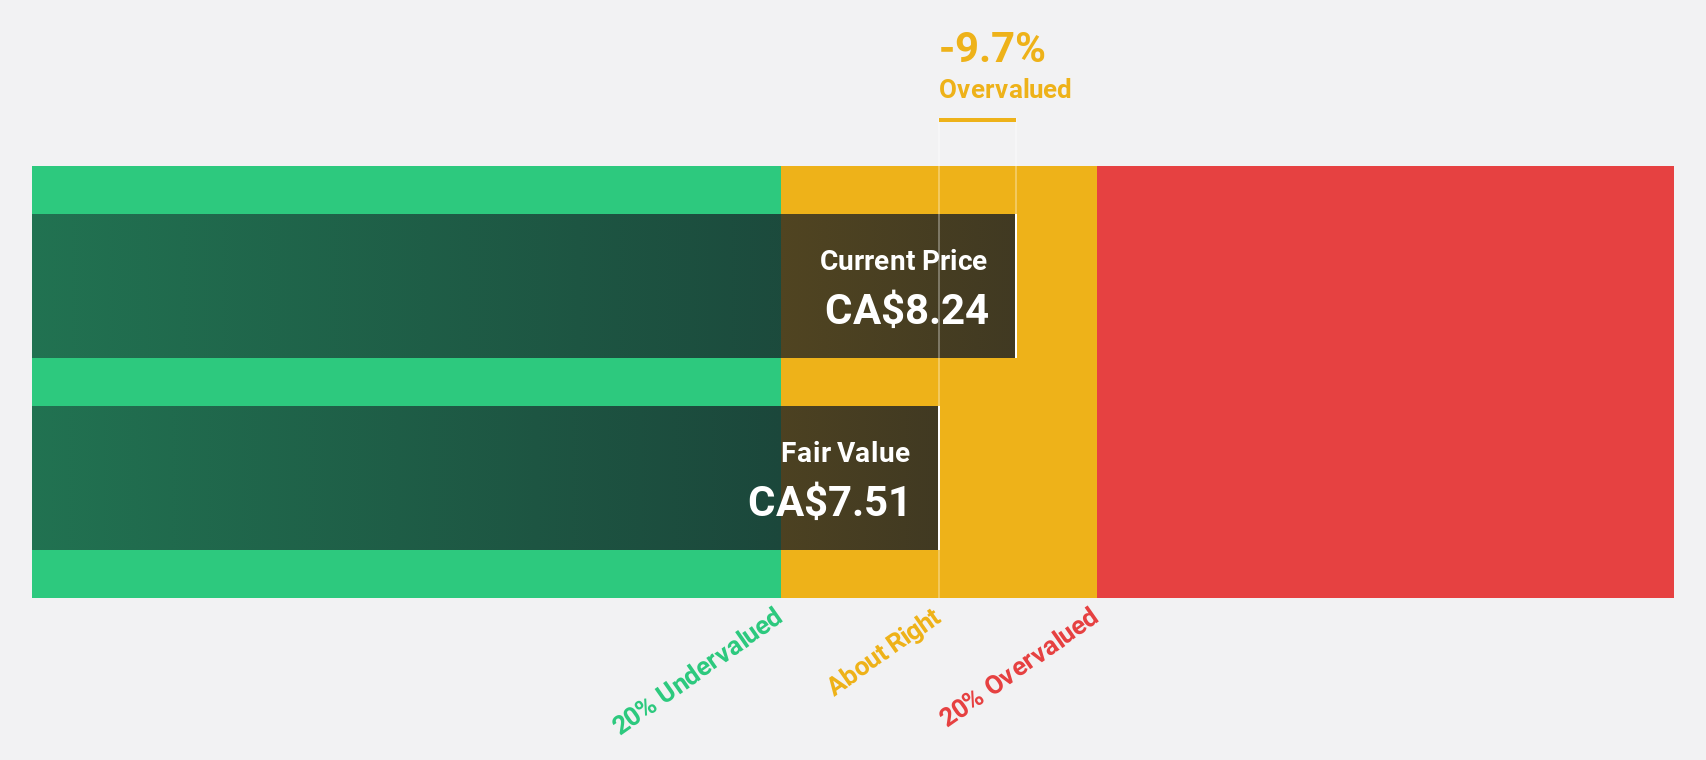
Estimated Discount To Fair Value: 10.4%
Energy Fuels, trading at CA$6.54, is slightly undervalued compared to its fair value estimate of CA$7.3. Despite a Q1 net loss of US$26.3 million, the company forecasts substantial revenue growth of 65.7% annually, surpassing market averages and indicating potential future profitability within three years. Recent production guidance updates reveal increased uranium output expectations for 2025, supporting cash flow prospects amid strategic expansions in rare earth elements and mineral resources processing capabilities.
- The analysis detailed in our Energy Fuels growth report hints at robust future financial performance.
- Take a closer look at Energy Fuels' balance sheet health here in our report.
Groupe Dynamite (TSX:GRGD)
Overview: Groupe Dynamite Inc. designs, distributes, and sells women's apparel in Canada and the United States, with a market cap of CA$1.49 billion.
Operations: The company generates revenue of CA$958.53 million from its women's apparel segment in Canada and the United States.
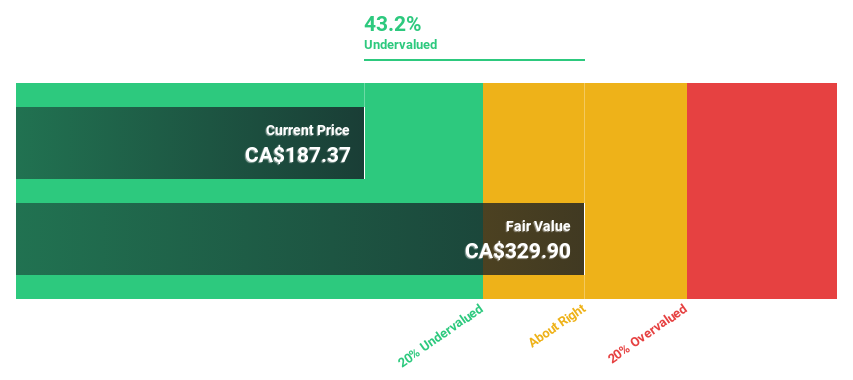
Estimated Discount To Fair Value: 47%
Groupe Dynamite, priced at CA$14.98, is significantly undervalued with a fair value estimate of CA$28.25. Recent earnings showed strong performance, with net income rising to CA$135.77 million for the year ending February 2025 from CA$85.82 million previously. The company forecasts earnings growth of 15.71% annually and revenue growth of 11.2%, both surpassing Canadian market averages, while implementing a share buyback program targeting up to 8.45% of its shares outstanding by April 2026.
- Our expertly prepared growth report on Groupe Dynamite implies its future financial outlook may be stronger than recent results.
- Get an in-depth perspective on Groupe Dynamite's balance sheet by reading our health report here.
Where To Now?
- Navigate through the entire inventory of 21 Undervalued TSX Stocks Based On Cash Flows here.
- Invested in any of these stocks? Simplify your portfolio management with Simply Wall St and stay ahead with our alerts for any critical updates on your stocks.
- Unlock the power of informed investing with Simply Wall St, your free guide to navigating stock markets worldwide.
Ready For A Different Approach?
- Explore high-performing small cap companies that haven't yet garnered significant analyst attention.
- Diversify your portfolio with solid dividend payers offering reliable income streams to weather potential market turbulence.
- Fuel your portfolio with companies showing strong growth potential, backed by optimistic outlooks both from analysts and management.
This article by Simply Wall St is general in nature. We provide commentary based on historical data and analyst forecasts only using an unbiased methodology and our articles are not intended to be financial advice. It does not constitute a recommendation to buy or sell any stock, and does not take account of your objectives, or your financial situation. We aim to bring you long-term focused analysis driven by fundamental data. Note that our analysis may not factor in the latest price-sensitive company announcements or qualitative material. Simply Wall St has no position in any stocks mentioned.
New: AI Stock Screener & Alerts
Our new AI Stock Screener scans the market every day to uncover opportunities.
• Dividend Powerhouses (3%+ Yield)
• Undervalued Small Caps with Insider Buying
• High growth Tech and AI Companies
Or build your own from over 50 metrics.
Have feedback on this article? Concerned about the content? Get in touch with us directly. Alternatively, email editorial-team@simplywallst.com
About TSX:CLS
Celestica
Provides supply chain solutions in Asia, North America, and internationally.
Exceptional growth potential with outstanding track record.
Similar Companies
Market Insights

Advertisement
Community Narratives
MINISO's fair value is projected at 26.69 with an anticipated PE ratio shift of 20x
Fair Value US$24.03|9.0% undervalued
BE
Community Contributor
Procter & Gamble: A Dividend Giant Facing Slowing Growth
Fair Value US$119.81|23.5% overvalued
AN
Community Contributor
Eli Lilly's Future Growth Driven by Tirzepatide and Favorable Market Conditions
Fair Value US$1.19k|14.4% undervalued
EA
Community Contributor