Estimating The Intrinsic Value Of MYND Life Sciences Inc. (CSE:MYND)


Key Insights
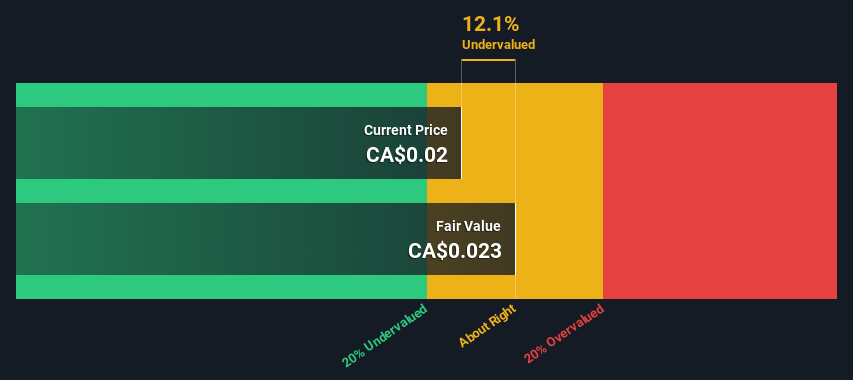
- MYND Life Sciences' estimated fair value is CA$0.023 based on 2 Stage Free Cash Flow to Equity
- Current share price of CA$0.02 suggests MYND Life Sciences is potentially trading close to its fair value
- MYND Life Sciences' peers are currently trading at a premium of 14% on average
Does the January share price for MYND Life Sciences Inc. (CSE:MYND) reflect what it's really worth? Today, we will estimate the stock's intrinsic value by taking the expected future cash flows and discounting them to their present value. We will use the Discounted Cash Flow (DCF) model on this occasion. There's really not all that much to it, even though it might appear quite complex.
We generally believe that a company's value is the present value of all of the cash it will generate in the future. However, a DCF is just one valuation metric among many, and it is not without flaws. For those who are keen learners of equity analysis, the Simply Wall St analysis model here may be something of interest to you.
View our latest analysis for MYND Life Sciences
The Model
We're using the 2-stage growth model, which simply means we take in account two stages of company's growth. In the initial period the company may have a higher growth rate and the second stage is usually assumed to have a stable growth rate. To start off with, we need to estimate the next ten years of cash flows. Seeing as no analyst estimates of free cash flow are available to us, we have extrapolate the previous free cash flow (FCF) from the company's last reported value. We assume companies with shrinking free cash flow will slow their rate of shrinkage, and that companies with growing free cash flow will see their growth rate slow, over this period. We do this to reflect that growth tends to slow more in the early years than it does in later years.
Generally we assume that a dollar today is more valuable than a dollar in the future, and so the sum of these future cash flows is then discounted to today's value:
10-year free cash flow (FCF) forecast
| 2024 | 2025 | 2026 | 2027 | 2028 | 2029 | 2030 | 2031 | 2032 | 2033 | |
| Levered FCF (CA$, Millions) | CA$30.9k | CA$41.2k | CA$51.2k | CA$60.1k | CA$67.7k | CA$74.2k | CA$79.6k | CA$84.1k | CA$87.9k | CA$91.2k |
| Growth Rate Estimate Source | Est @ 47.08% | Est @ 33.53% | Est @ 24.05% | Est @ 17.41% | Est @ 12.77% | Est @ 9.52% | Est @ 7.24% | Est @ 5.65% | Est @ 4.53% | Est @ 3.75% |
| Present Value (CA$, Millions) Discounted @ 8.2% | CA$0.03 | CA$0.04 | CA$0.04 | CA$0.04 | CA$0.05 | CA$0.05 | CA$0.05 | CA$0.04 | CA$0.04 | CA$0.04 |
("Est" = FCF growth rate estimated by Simply Wall St)
Present Value of 10-year Cash Flow (PVCF) = CA$415k
The second stage is also known as Terminal Value, this is the business's cash flow after the first stage. For a number of reasons a very conservative growth rate is used that cannot exceed that of a country's GDP growth. In this case we have used the 5-year average of the 10-year government bond yield (1.9%) to estimate future growth. In the same way as with the 10-year 'growth' period, we discount future cash flows to today's value, using a cost of equity of 8.2%.
Terminal Value (TV)= FCF2033 × (1 + g) ÷ (r – g) = CA$91k× (1 + 1.9%) ÷ (8.2%– 1.9%) = CA$1.5m
Present Value of Terminal Value (PVTV)= TV / (1 + r)10= CA$1.5m÷ ( 1 + 8.2%)10= CA$672k
The total value, or equity value, is then the sum of the present value of the future cash flows, which in this case is CA$1.1m. In the final step we divide the equity value by the number of shares outstanding. Compared to the current share price of CA$0.02, the company appears about fair value at a 12% discount to where the stock price trades currently. Remember though, that this is just an approximate valuation, and like any complex formula - garbage in, garbage out.
Important Assumptions
The calculation above is very dependent on two assumptions. The first is the discount rate and the other is the cash flows. You don't have to agree with these inputs, I recommend redoing the calculations yourself and playing with them. The DCF also does not consider the possible cyclicality of an industry, or a company's future capital requirements, so it does not give a full picture of a company's potential performance. Given that we are looking at MYND Life Sciences as potential shareholders, the cost of equity is used as the discount rate, rather than the cost of capital (or weighted average cost of capital, WACC) which accounts for debt. In this calculation we've used 8.2%, which is based on a levered beta of 1.256. Beta is a measure of a stock's volatility, compared to the market as a whole. We get our beta from the industry average beta of globally comparable companies, with an imposed limit between 0.8 and 2.0, which is a reasonable range for a stable business.
SWOT Analysis for MYND Life Sciences
- No major strengths identified for MYND.
- Shareholders have been diluted in the past year.
- Has sufficient cash runway for more than 3 years based on current free cash flows.
- Current share price is below our estimate of fair value.
- Lack of analyst coverage makes it difficult to determine MYND's earnings prospects.
- Debt is not well covered by operating cash flow.
- Total liabilities exceed total assets, which raises the risk of financial distress.
Looking Ahead:
Although the valuation of a company is important, it is only one of many factors that you need to assess for a company. It's not possible to obtain a foolproof valuation with a DCF model. Rather it should be seen as a guide to "what assumptions need to be true for this stock to be under/overvalued?" If a company grows at a different rate, or if its cost of equity or risk free rate changes sharply, the output can look very different. For MYND Life Sciences, we've put together three fundamental factors you should explore:
- Risks: Be aware that MYND Life Sciences is showing 6 warning signs in our investment analysis , and 5 of those shouldn't be ignored...
- Other Solid Businesses: Low debt, high returns on equity and good past performance are fundamental to a strong business. Why not explore our interactive list of stocks with solid business fundamentals to see if there are other companies you may not have considered!
- Other Top Analyst Picks: Interested to see what the analysts are thinking? Take a look at our interactive list of analysts' top stock picks to find out what they feel might have an attractive future outlook!
PS. The Simply Wall St app conducts a discounted cash flow valuation for every stock on the CNSX every day. If you want to find the calculation for other stocks just search here.
New: Manage All Your Stock Portfolios in One Place
We've created the ultimate portfolio companion for stock investors, and it's free.
• Connect an unlimited number of Portfolios and see your total in one currency
• Be alerted to new Warning Signs or Risks via email or mobile
• Track the Fair Value of your stocks
Have feedback on this article? Concerned about the content? Get in touch with us directly. Alternatively, email editorial-team (at) simplywallst.com.
This article by Simply Wall St is general in nature. We provide commentary based on historical data and analyst forecasts only using an unbiased methodology and our articles are not intended to be financial advice. It does not constitute a recommendation to buy or sell any stock, and does not take account of your objectives, or your financial situation. We aim to bring you long-term focused analysis driven by fundamental data. Note that our analysis may not factor in the latest price-sensitive company announcements or qualitative material. Simply Wall St has no position in any stocks mentioned.
About CNSX:MYND
MYND Life Sciences
A life sciences-based neuro-pharmaceutical drug development company, advances medicines based on neuro-anti-inflammatory substances for depressive disorders through science and clinical trials in Canada and the United States.
Moderate with weak fundamentals.
Market Insights

Community Narratives

