- Canada
- /
- Metals and Mining
- /
- TSXV:IB
It's Down 27% But IBC Advanced Alloys Corp. (CVE:IB) Could Be Riskier Than It Looks

IBC Advanced Alloys Corp. (CVE:IB) shareholders won't be pleased to see that the share price has had a very rough month, dropping 27% and undoing the prior period's positive performance. The drop over the last 30 days has capped off a tough year for shareholders, with the share price down 21% in that time.
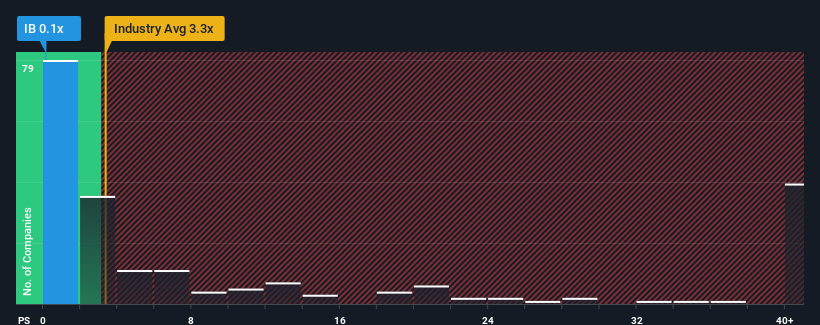
After such a large drop in price, IBC Advanced Alloys may look like a strong buying opportunity at present with its price-to-sales (or "P/S") ratio of 0.1x, considering almost half of all companies in the Metals and Mining industry in Canada have P/S ratios greater than 3.3x and even P/S higher than 22x aren't out of the ordinary. Although, it's not wise to just take the P/S at face value as there may be an explanation why it's so limited.
See our latest analysis for IBC Advanced Alloys
How Has IBC Advanced Alloys Performed Recently?
IBC Advanced Alloys has been doing a good job lately as it's been growing revenue at a solid pace. Perhaps the market is expecting this acceptable revenue performance to take a dive, which has kept the P/S suppressed. Those who are bullish on IBC Advanced Alloys will be hoping that this isn't the case, so that they can pick up the stock at a lower valuation.
We don't have analyst forecasts, but you can see how recent trends are setting up the company for the future by checking out our free report on IBC Advanced Alloys' earnings, revenue and cash flow.Do Revenue Forecasts Match The Low P/S Ratio?
IBC Advanced Alloys' P/S ratio would be typical for a company that's expected to deliver very poor growth or even falling revenue, and importantly, perform much worse than the industry.
Retrospectively, the last year delivered an exceptional 24% gain to the company's top line. The strong recent performance means it was also able to grow revenue by 73% in total over the last three years. Therefore, it's fair to say the revenue growth recently has been superb for the company.
It's interesting to note that the rest of the industry is similarly expected to grow by 20% over the next year, which is fairly even with the company's recent medium-term annualised growth rates.
With this information, we find it odd that IBC Advanced Alloys is trading at a P/S lower than the industry. Apparently some shareholders are more bearish than recent times would indicate and have been accepting lower selling prices.
What We Can Learn From IBC Advanced Alloys' P/S?
Having almost fallen off a cliff, IBC Advanced Alloys' share price has pulled its P/S way down as well. It's argued the price-to-sales ratio is an inferior measure of value within certain industries, but it can be a powerful business sentiment indicator.
Our examination of IBC Advanced Alloys revealed its three-year revenue trends looking similar to current industry expectations hasn't given the P/S the boost we expected, given that it's lower than the wider industry P/S, When we see industry-like revenue growth but a lower than expected P/S, we assume potential risks are what might be placing downward pressure on the share price. revenue trends suggest that the risk of a price decline is low, investors appear to perceive a possibility of revenue volatility in the future.
There are also other vital risk factors to consider and we've discovered 5 warning signs for IBC Advanced Alloys (4 are potentially serious!) that you should be aware of before investing here.
If you're unsure about the strength of IBC Advanced Alloys' business, why not explore our interactive list of stocks with solid business fundamentals for some other companies you may have missed.
Mobile Infrastructure for Defense and Disaster
The next wave in robotics isn't humanoid. Its fully autonomous towers delivering 5G, ISR, and radar in under 30 minutes, anywhere.
Get the investor briefing before the next round of contracts
Sponsored On Behalf of CiTechNew: AI Stock Screener & Alerts
Our new AI Stock Screener scans the market every day to uncover opportunities.
• Dividend Powerhouses (3%+ Yield)
• Undervalued Small Caps with Insider Buying
• High growth Tech and AI Companies
Or build your own from over 50 metrics.
Have feedback on this article? Concerned about the content? Get in touch with us directly. Alternatively, email editorial-team (at) simplywallst.com.
This article by Simply Wall St is general in nature. We provide commentary based on historical data and analyst forecasts only using an unbiased methodology and our articles are not intended to be financial advice. It does not constitute a recommendation to buy or sell any stock, and does not take account of your objectives, or your financial situation. We aim to bring you long-term focused analysis driven by fundamental data. Note that our analysis may not factor in the latest price-sensitive company announcements or qualitative material. Simply Wall St has no position in any stocks mentioned.
About TSXV:IB
IBC Advanced Alloys
Develops, produces, and sells specialty alloy products in the United States, China, the Netherlands, Japan, Canada, Germany, South Korea, Taiwan, Italy, and internationally.
Mediocre balance sheet and slightly overvalued.
Similar Companies
Market Insights

Weekly Picks

Early mover in a fast growing industry. Likely to experience share price volatility as they scale


A case for CA$31.80 (undiluted), aka 8,616% upside from CA$0.37 (an 86 bagger!).


Moderation and Stabilisation: HOLD: Fair Price based on a 4-year Cycle is $12.08
Recently Updated Narratives


An amazing opportunity to potentially get a 100 bagger

Amazon: Why the World’s Biggest Platform Still Runs on Invisible Economics

Sunrun Stock: When the Energy Transition Collides With the Cost of Capital
Popular Narratives


MicroVision will explode future revenue by 380.37% with a vision towards success


Crazy Undervalued 42 Baggers Silver Play (Active & Running Mine)


NVDA: Expanding AI Demand Will Drive Major Data Center Investments Through 2026
Trending Discussion