
Advertisement

Want to participate in a short research study? Help shape the future of investing tools and receive a $20 prize!
Today we'll evaluate Corsa Coal Corp. (CVE:CSO) to determine whether it could have potential as an investment idea. Specifically, we're going to calculate its Return On Capital Employed (ROCE), in the hopes of getting some insight into the business.
First, we'll go over how we calculate ROCE. Next, we'll compare it to others in its industry. Then we'll determine how its current liabilities are affecting its ROCE.
Return On Capital Employed (ROCE): What is it?
ROCE is a measure of a company's yearly pre-tax profit (its return), relative to the capital employed in the business. All else being equal, a better business will have a higher ROCE. Ultimately, it is a useful but imperfect metric. Renowned investment researcher Michael Mauboussin has suggested that a high ROCE can indicate that 'one dollar invested in the company generates value of more than one dollar'.
So, How Do We Calculate ROCE?
Analysts use this formula to calculate return on capital employed:
Return on Capital Employed = Earnings Before Interest and Tax (EBIT) ÷ (Total Assets - Current Liabilities)
Or for Corsa Coal:
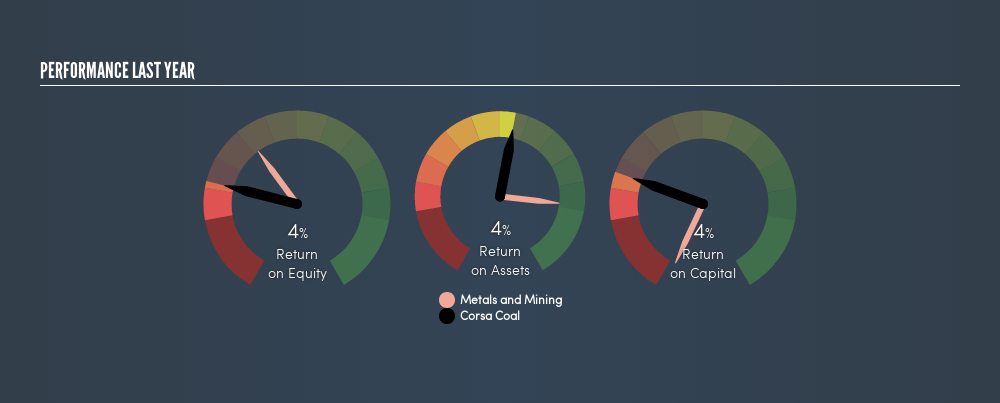
0.036 = US$8.4m ÷ (US$283m - US$51m) (Based on the trailing twelve months to December 2018.)
Therefore, Corsa Coal has an ROCE of 3.6%.
View our latest analysis for Corsa Coal
Is Corsa Coal's ROCE Good?
One way to assess ROCE is to compare similar companies. In our analysis, Corsa Coal's ROCE is meaningfully higher than the 2.7% average in the Metals and Mining industry. We consider this a positive sign, because it suggests it uses capital more efficiently than similar companies. Regardless of how Corsa Coal stacks up against its industry, its ROCE in absolute terms is quite low (especially compared to a bank account). It is likely that there are more attractive prospects out there.
Corsa Coal reported an ROCE of 3.6% -- better than 3 years ago, when the company didn't make a profit. That implies the business has been improving.
Remember that this metric is backwards looking - it shows what has happened in the past, and does not accurately predict the future. Companies in cyclical industries can be difficult to understand using ROCE, as returns typically look high during boom times, and low during busts. ROCE is only a point-in-time measure. Given the industry it operates in, Corsa Coal could be considered cyclical. Future performance is what matters, and you can see analyst predictions in our freereport on analyst forecasts for the company.
How Corsa Coal's Current Liabilities Impact Its ROCE
Current liabilities include invoices, such as supplier payments, short-term debt, or a tax bill, that need to be paid within 12 months. Due to the way the ROCE equation works, having large bills due in the near term can make it look as though a company has less capital employed, and thus a higher ROCE than usual. To counter this, investors can check if a company has high current liabilities relative to total assets.
Corsa Coal has total liabilities of US$51m and total assets of US$283m. As a result, its current liabilities are equal to approximately 18% of its total assets. This is a modest level of current liabilities, which will have a limited impact on the ROCE.
Our Take On Corsa Coal's ROCE
While that is good to see, Corsa Coal has a low ROCE and does not look attractive in this analysis. You might be able to find a better buy than Corsa Coal. If you want a selection of possible winners, check out this freelist of interesting companies that trade on a P/E below 20 (but have proven they can grow earnings).
For those who like to find winning investments this freelist of growing companies with recent insider purchasing, could be just the ticket.
We aim to bring you long-term focused research analysis driven by fundamental data. Note that our analysis may not factor in the latest price-sensitive company announcements or qualitative material.
If you spot an error that warrants correction, please contact the editor at editorial-team@simplywallst.com. This article by Simply Wall St is general in nature. It does not constitute a recommendation to buy or sell any stock, and does not take account of your objectives, or your financial situation. Simply Wall St has no position in the stocks mentioned. Thank you for reading.
About TSXV:CSO.H
Corsa Coal
Corsa Coal Corp. mines, processes, and sells metallurgical coal in the Asia, North America, South America, and Europe.
Good value with mediocre balance sheet.
Similar Companies
Market Insights


Advertisement
Community Narratives
The Future of Drug Testing? Fingerprint Tech Shows Serious Promise
Fair Value US$2.98|40.3% undervalued
JO
Community Contributor
Suncorp’s Next Chapter: Insurance-Only and Ready to Grow
Fair Value AU$22.83|7.6% undervalued
RO
Community Contributor
Thyssenkrupp Nucera Will Achieve Double-Digit Profits by 2030 Boosted by Hydrogen Growth
Fair Value €14.40|31.6% undervalued
CH
Community Contributor
Tesla’s Nvidia Moment – The AI & Robotics Inflection Point
Fair Value US$359.72|12.3% undervalued
BL
Community Contributor