

Howard Marks put it nicely when he said that, rather than worrying about share price volatility, 'The possibility of permanent loss is the risk I worry about... and every practical investor I know worries about.' It's only natural to consider a company's balance sheet when you examine how risky it is, since debt is often involved when a business collapses. We can see that Blue Star Gold Corp. (CVE:BAU) does use debt in its business. But is this debt a concern to shareholders?
Why Does Debt Bring Risk?
Debt assists a business until the business has trouble paying it off, either with new capital or with free cash flow. In the worst case scenario, a company can go bankrupt if it cannot pay its creditors. However, a more frequent (but still costly) occurrence is where a company must issue shares at bargain-basement prices, permanently diluting shareholders, just to shore up its balance sheet. By replacing dilution, though, debt can be an extremely good tool for businesses that need capital to invest in growth at high rates of return. The first step when considering a company's debt levels is to consider its cash and debt together.
Check out our latest analysis for Blue Star Gold
What Is Blue Star Gold's Net Debt?
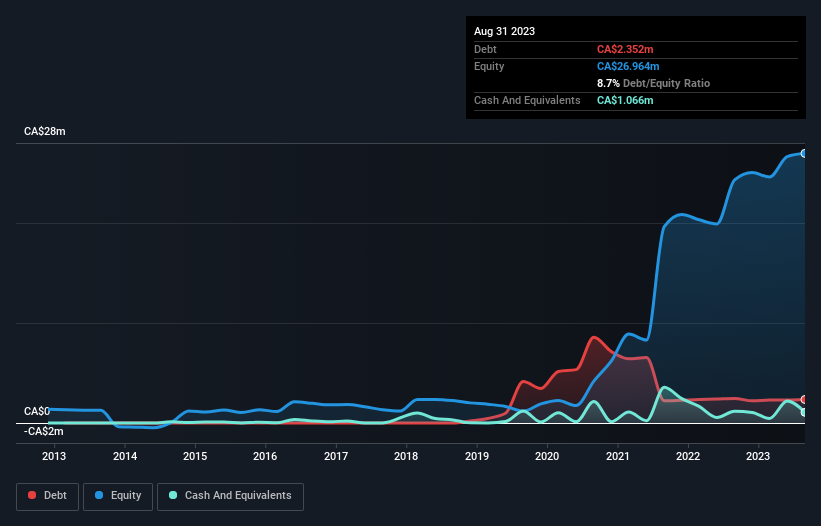
The image below, which you can click on for greater detail, shows that Blue Star Gold had debt of CA$2.35m at the end of August 2023, a reduction from CA$2.46m over a year. On the flip side, it has CA$1.07m in cash leading to net debt of about CA$1.29m.
How Healthy Is Blue Star Gold's Balance Sheet?
We can see from the most recent balance sheet that Blue Star Gold had liabilities of CA$508.2k falling due within a year, and liabilities of CA$2.53m due beyond that. Offsetting this, it had CA$1.07m in cash and CA$95.7k in receivables that were due within 12 months. So its liabilities total CA$1.88m more than the combination of its cash and short-term receivables.
Given Blue Star Gold has a market capitalization of CA$25.3m, it's hard to believe these liabilities pose much threat. Having said that, it's clear that we should continue to monitor its balance sheet, lest it change for the worse. When analysing debt levels, the balance sheet is the obvious place to start. But you can't view debt in total isolation; since Blue Star Gold will need earnings to service that debt. So if you're keen to discover more about its earnings, it might be worth checking out this graph of its long term earnings trend.
Given its lack of meaningful operating revenue, investors are probably hoping that Blue Star Gold finds some valuable resources, before it runs out of money.
Caveat Emptor
Over the last twelve months Blue Star Gold produced an earnings before interest and tax (EBIT) loss. Indeed, it lost CA$2.2m at the EBIT level. Considering that alongside the liabilities mentioned above does not give us much confidence that company should be using so much debt. Quite frankly we think the balance sheet is far from match-fit, although it could be improved with time. Another cause for caution is that is bled CA$4.8m in negative free cash flow over the last twelve months. So in short it's a really risky stock. There's no doubt that we learn most about debt from the balance sheet. However, not all investment risk resides within the balance sheet - far from it. For example, we've discovered 6 warning signs for Blue Star Gold (4 are concerning!) that you should be aware of before investing here.
At the end of the day, it's often better to focus on companies that are free from net debt. You can access our special list of such companies (all with a track record of profit growth). It's free.
If you're looking to trade Blue Star Gold, open an account with the lowest-cost platform trusted by professionals, Interactive Brokers.
With clients in over 200 countries and territories, and access to 160 markets, IBKR lets you trade stocks, options, futures, forex, bonds and funds from a single integrated account.
Enjoy no hidden fees, no account minimums, and FX conversion rates as low as 0.03%, far better than what most brokers offer.
Sponsored ContentValuation is complex, but we're here to simplify it.
Discover if Blue Star Gold might be undervalued or overvalued with our detailed analysis, featuring fair value estimates, potential risks, dividends, insider trades, and its financial condition.
Access Free AnalysisHave feedback on this article? Concerned about the content? Get in touch with us directly. Alternatively, email editorial-team (at) simplywallst.com.
This article by Simply Wall St is general in nature. We provide commentary based on historical data and analyst forecasts only using an unbiased methodology and our articles are not intended to be financial advice. It does not constitute a recommendation to buy or sell any stock, and does not take account of your objectives, or your financial situation. We aim to bring you long-term focused analysis driven by fundamental data. Note that our analysis may not factor in the latest price-sensitive company announcements or qualitative material. Simply Wall St has no position in any stocks mentioned.
About TSXV:BAU
Blue Star Gold
Engages in the acquiring, exploring, and evaluating mineral properties in Canada.
Moderate with mediocre balance sheet.
Market Insights

Community Narratives


