
Advertisement
- Canada
- /
- Paper and Forestry Products
- /
- TSXV:AEP
Atlas Engineered Products Ltd.'s (CVE:AEP) Stock Is Going Strong: Have Financials A Role To Play?

Atlas Engineered Products (CVE:AEP) has had a great run on the share market with its stock up by a significant 15% over the last week. We wonder if and what role the company's financials play in that price change as a company's long-term fundamentals usually dictate market outcomes. In this article, we decided to focus on Atlas Engineered Products' ROE.
Return on Equity or ROE is a test of how effectively a company is growing its value and managing investors’ money. Simply put, it is used to assess the profitability of a company in relation to its equity capital.
Check out our latest analysis for Atlas Engineered Products
How To Calculate Return On Equity?
The formula for ROE is:
Return on Equity = Net Profit (from continuing operations) ÷ Shareholders' Equity
So, based on the above formula, the ROE for Atlas Engineered Products is:
3.2% = CA$1.5m ÷ CA$48m (Based on the trailing twelve months to June 2024).
The 'return' is the amount earned after tax over the last twelve months. Another way to think of that is that for every CA$1 worth of equity, the company was able to earn CA$0.03 in profit.
What Is The Relationship Between ROE And Earnings Growth?
We have already established that ROE serves as an efficient profit-generating gauge for a company's future earnings. Based on how much of its profits the company chooses to reinvest or "retain", we are then able to evaluate a company's future ability to generate profits. Assuming all else is equal, companies that have both a higher return on equity and higher profit retention are usually the ones that have a higher growth rate when compared to companies that don't have the same features.
Atlas Engineered Products' Earnings Growth And 3.2% ROE
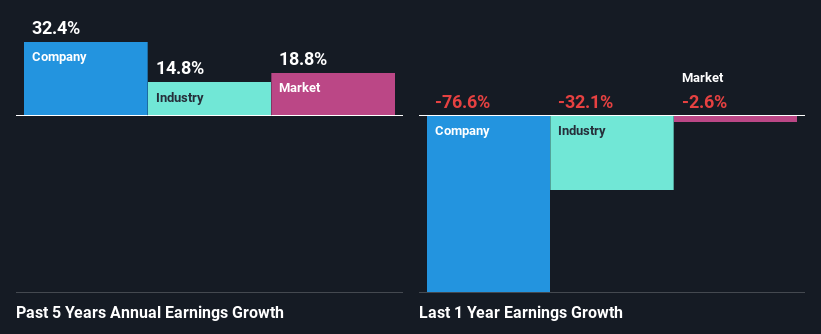
As you can see, Atlas Engineered Products' ROE looks pretty weak. Even compared to the average industry ROE of 8.3%, the company's ROE is quite dismal. However, we we're pleasantly surprised to see that Atlas Engineered Products grew its net income at a significant rate of 32% in the last five years. We believe that there might be other aspects that are positively influencing the company's earnings growth. For example, it is possible that the company's management has made some good strategic decisions, or that the company has a low payout ratio.
We then compared Atlas Engineered Products' net income growth with the industry and we're pleased to see that the company's growth figure is higher when compared with the industry which has a growth rate of 15% in the same 5-year period.
Earnings growth is a huge factor in stock valuation. It’s important for an investor to know whether the market has priced in the company's expected earnings growth (or decline). By doing so, they will have an idea if the stock is headed into clear blue waters or if swampy waters await. Is Atlas Engineered Products fairly valued compared to other companies? These 3 valuation measures might help you decide.
Is Atlas Engineered Products Efficiently Re-investing Its Profits?
Given that Atlas Engineered Products doesn't pay any regular dividends to its shareholders, we infer that the company has been reinvesting all of its profits to grow its business.
Conclusion
In total, it does look like Atlas Engineered Products has some positive aspects to its business. Despite its low rate of return, the fact that the company reinvests a very high portion of its profits into its business, no doubt contributed to its high earnings growth. While we won't completely dismiss the company, what we would do, is try to ascertain how risky the business is to make a more informed decision around the company. You can see the 3 risks we have identified for Atlas Engineered Products by visiting our risks dashboard for free on our platform here.
New: Manage All Your Stock Portfolios in One Place
We've created the ultimate portfolio companion for stock investors, and it's free.
• Connect an unlimited number of Portfolios and see your total in one currency
• Be alerted to new Warning Signs or Risks via email or mobile
• Track the Fair Value of your stocks
Have feedback on this article? Concerned about the content? Get in touch with us directly. Alternatively, email editorial-team (at) simplywallst.com.
This article by Simply Wall St is general in nature. We provide commentary based on historical data and analyst forecasts only using an unbiased methodology and our articles are not intended to be financial advice. It does not constitute a recommendation to buy or sell any stock, and does not take account of your objectives, or your financial situation. We aim to bring you long-term focused analysis driven by fundamental data. Note that our analysis may not factor in the latest price-sensitive company announcements or qualitative material. Simply Wall St has no position in any stocks mentioned.
About TSXV:AEP
Atlas Engineered Products
Designs, manufactures, and sells engineered roof trusses, floor trusses, and wall panels in Canada.
Adequate balance sheet and slightly overvalued.
Market Insights


Advertisement
Community Narratives
For the Emperor: Why Games Workshop Could Be a Star Investment
Fair Value UK£160.00|0.4% overvalued
RO
Community Contributor
Securitas will boost margins with AI and tech-driven services
Fair Value SEK 260.91|43.9% undervalued
UN
Community Contributor
A Leader in EV Charging with Growth Potential
Fair Value €27.00|14.6% undervalued
TI
Community Contributor