
Advertisement
Key Insights
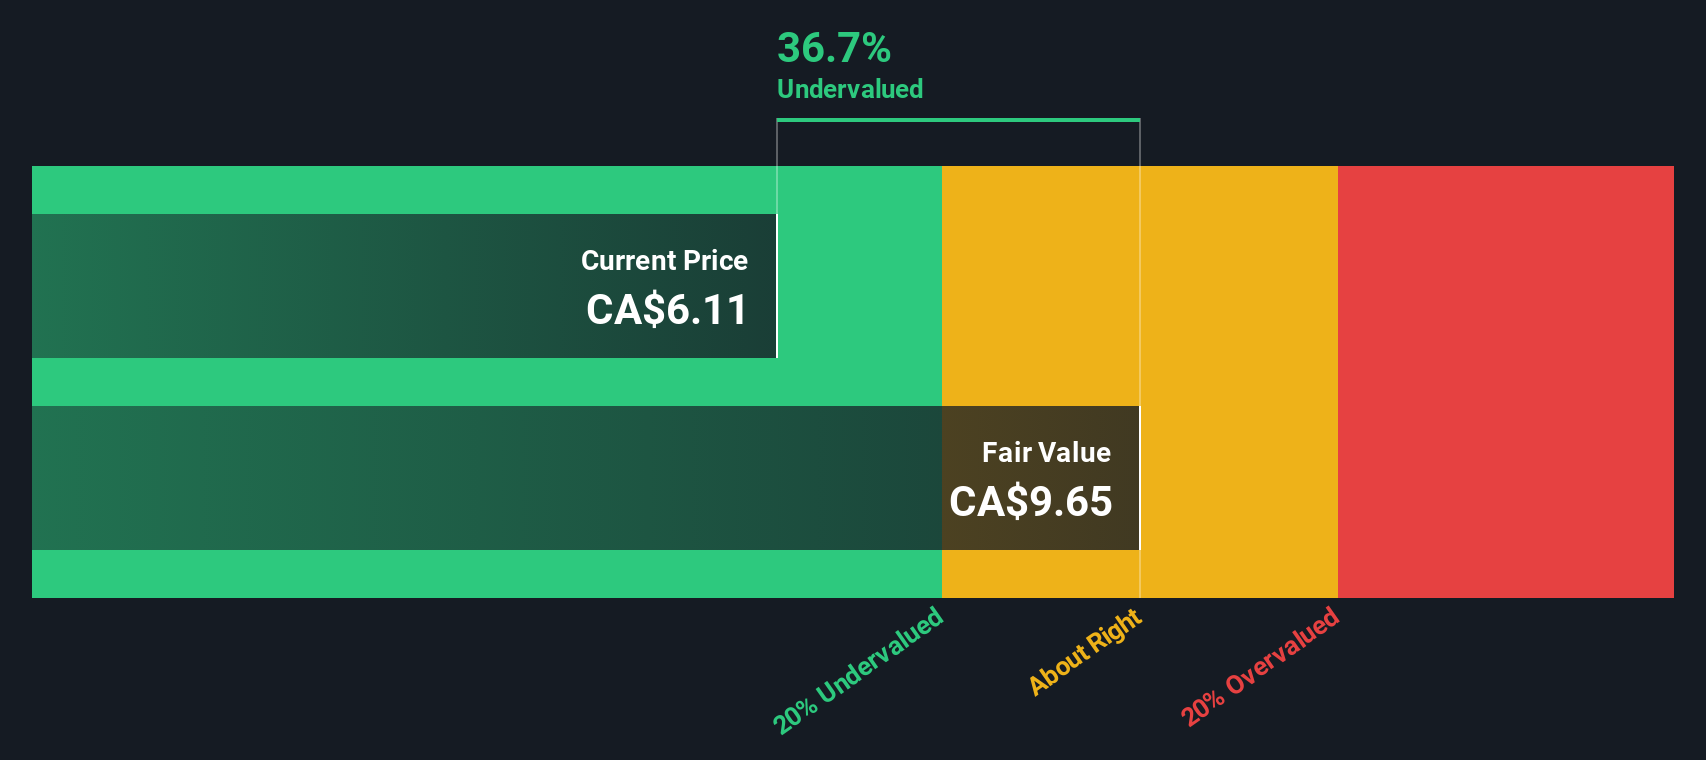
- The projected fair value for OceanaGold is CA$9.65 based on 2 Stage Free Cash Flow to Equity
- Current share price of CA$6.11 suggests OceanaGold is potentially 37% undervalued
- Analyst price target for OGC is US$6.62 which is 31% below our fair value estimate
In this article we are going to estimate the intrinsic value of OceanaGold Corporation (TSE:OGC) by taking the expected future cash flows and discounting them to their present value. This will be done using the Discounted Cash Flow (DCF) model. Before you think you won't be able to understand it, just read on! It's actually much less complex than you'd imagine.
We generally believe that a company's value is the present value of all of the cash it will generate in the future. However, a DCF is just one valuation metric among many, and it is not without flaws. Anyone interested in learning a bit more about intrinsic value should have a read of the Simply Wall St analysis model.
Step By Step Through The Calculation
We use what is known as a 2-stage model, which simply means we have two different periods of growth rates for the company's cash flows. Generally the first stage is higher growth, and the second stage is a lower growth phase. In the first stage we need to estimate the cash flows to the business over the next ten years. Where possible we use analyst estimates, but when these aren't available we extrapolate the previous free cash flow (FCF) from the last estimate or reported value. We assume companies with shrinking free cash flow will slow their rate of shrinkage, and that companies with growing free cash flow will see their growth rate slow, over this period. We do this to reflect that growth tends to slow more in the early years than it does in later years.
Generally we assume that a dollar today is more valuable than a dollar in the future, and so the sum of these future cash flows is then discounted to today's value:
10-year free cash flow (FCF) estimate
| 2025 | 2026 | 2027 | 2028 | 2029 | 2030 | 2031 | 2032 | 2033 | 2034 | |
| Levered FCF ($, Millions) | US$200.7m | US$420.1m | US$326.5m | US$276.2m | US$248.5m | US$232.9m | US$224.4m | US$220.3m | US$219.2m | US$220.0m |
| Growth Rate Estimate Source | Analyst x8 | Analyst x9 | Analyst x6 | Est @ -15.41% | Est @ -10.04% | Est @ -6.28% | Est @ -3.65% | Est @ -1.81% | Est @ -0.52% | Est @ 0.38% |
| Present Value ($, Millions) Discounted @ 6.5% | US$188 | US$370 | US$270 | US$215 | US$181 | US$160 | US$144 | US$133 | US$124 | US$117 |
("Est" = FCF growth rate estimated by Simply Wall St)
Present Value of 10-year Cash Flow (PVCF) = US$1.9b
We now need to calculate the Terminal Value, which accounts for all the future cash flows after this ten year period. For a number of reasons a very conservative growth rate is used that cannot exceed that of a country's GDP growth. In this case we have used the 5-year average of the 10-year government bond yield (2.5%) to estimate future growth. In the same way as with the 10-year 'growth' period, we discount future cash flows to today's value, using a cost of equity of 6.5%.
Terminal Value (TV)= FCF2034 × (1 + g) ÷ (r – g) = US$220m× (1 + 2.5%) ÷ (6.5%– 2.5%) = US$5.6b
Present Value of Terminal Value (PVTV)= TV / (1 + r)10= US$5.6b÷ ( 1 + 6.5%)10= US$3.0b
The total value is the sum of cash flows for the next ten years plus the discounted terminal value, which results in the Total Equity Value, which in this case is US$4.9b. In the final step we divide the equity value by the number of shares outstanding. Relative to the current share price of CA$6.1, the company appears quite good value at a 37% discount to where the stock price trades currently. Valuations are imprecise instruments though, rather like a telescope - move a few degrees and end up in a different galaxy. Do keep this in mind.
The Assumptions
Now the most important inputs to a discounted cash flow are the discount rate, and of course, the actual cash flows. Part of investing is coming up with your own evaluation of a company's future performance, so try the calculation yourself and check your own assumptions. The DCF also does not consider the possible cyclicality of an industry, or a company's future capital requirements, so it does not give a full picture of a company's potential performance. Given that we are looking at OceanaGold as potential shareholders, the cost of equity is used as the discount rate, rather than the cost of capital (or weighted average cost of capital, WACC) which accounts for debt. In this calculation we've used 6.5%, which is based on a levered beta of 0.925. Beta is a measure of a stock's volatility, compared to the market as a whole. We get our beta from the industry average beta of globally comparable companies, with an imposed limit between 0.8 and 2.0, which is a reasonable range for a stable business.
See our latest analysis for OceanaGold
SWOT Analysis for OceanaGold
Strength
- Earnings growth over the past year exceeded the industry.
- Currently debt free.
- Dividends are covered by earnings and cash flows.
Weakness
- Dividend is low compared to the top 25% of dividend payers in the Metals and Mining market.
Opportunity
- Annual earnings are forecast to grow faster than the Canadian market.
- Good value based on P/E ratio and estimated fair value.
Threat
- Revenue is forecast to grow slower than 20% per year.
Looking Ahead:
Although the valuation of a company is important, it is only one of many factors that you need to assess for a company. The DCF model is not a perfect stock valuation tool. Preferably you'd apply different cases and assumptions and see how they would impact the company's valuation. For instance, if the terminal value growth rate is adjusted slightly, it can dramatically alter the overall result. Can we work out why the company is trading at a discount to intrinsic value? For OceanaGold, we've put together three pertinent items you should further research:
- Risks: For example, we've discovered 1 warning sign for OceanaGold that you should be aware of before investing here.
- Management:Have insiders been ramping up their shares to take advantage of the market's sentiment for OGC's future outlook? Check out our management and board analysis with insights on CEO compensation and governance factors.
- Other Solid Businesses: Low debt, high returns on equity and good past performance are fundamental to a strong business. Why not explore our interactive list of stocks with solid business fundamentals to see if there are other companies you may not have considered!
PS. Simply Wall St updates its DCF calculation for every Canadian stock every day, so if you want to find the intrinsic value of any other stock just search here.
New: AI Stock Screener & Alerts
Our new AI Stock Screener scans the market every day to uncover opportunities.
• Dividend Powerhouses (3%+ Yield)
• Undervalued Small Caps with Insider Buying
• High growth Tech and AI Companies
Or build your own from over 50 metrics.
Have feedback on this article? Concerned about the content? Get in touch with us directly. Alternatively, email editorial-team (at) simplywallst.com.
This article by Simply Wall St is general in nature. We provide commentary based on historical data and analyst forecasts only using an unbiased methodology and our articles are not intended to be financial advice. It does not constitute a recommendation to buy or sell any stock, and does not take account of your objectives, or your financial situation. We aim to bring you long-term focused analysis driven by fundamental data. Note that our analysis may not factor in the latest price-sensitive company announcements or qualitative material. Simply Wall St has no position in any stocks mentioned.
About TSX:OGC
OceanaGold
A gold and copper producer, engages in exploration, development, and operation of mineral properties in the United States, the Philippines, and New Zealand.
Very undervalued with flawless balance sheet.
Similar Companies
Market Insights

Advertisement
Community Narratives
MicroVision will explode future revenue by 380.37% with a vision towards success
Fair Value US$60.00|98.4% undervalued
TH
Community Contributor
The Indispensable Artery for a New North American Economy
Fair Value CA$132.87|1.3% undervalued
TI
Community Contributor