
Advertisement
- Canada
- /
- Metals and Mining
- /
- TSX:FVI
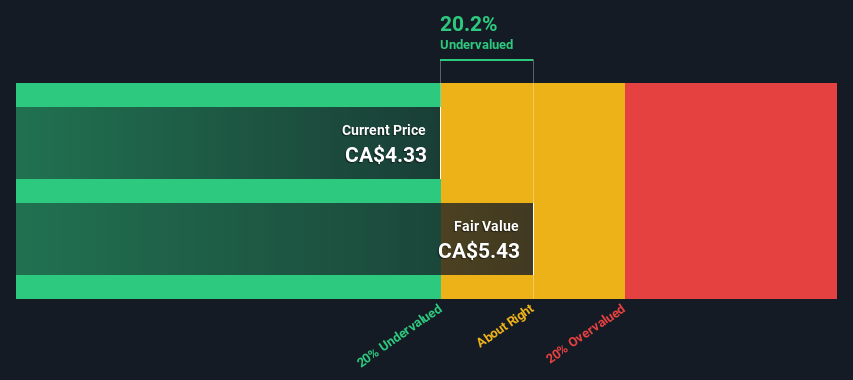
Fortuna Silver Mines Inc. (TSE:FVI) Shares Could Be 20% Below Their Intrinsic Value Estimate

Key Insights
- Using the 2 Stage Free Cash Flow to Equity, Fortuna Silver Mines fair value estimate is CA$5.43
- Current share price of CA$4.33 suggests Fortuna Silver Mines is potentially 20% undervalued
- Analyst price target for FVI is US$5.94, which is 9.5% above our fair value estimate
Today we will run through one way of estimating the intrinsic value of Fortuna Silver Mines Inc. (TSE:FVI) by taking the expected future cash flows and discounting them to today's value. We will use the Discounted Cash Flow (DCF) model on this occasion. It may sound complicated, but actually it is quite simple!
We would caution that there are many ways of valuing a company and, like the DCF, each technique has advantages and disadvantages in certain scenarios. For those who are keen learners of equity analysis, the Simply Wall St analysis model here may be something of interest to you.
Check out our latest analysis for Fortuna Silver Mines
Step By Step Through The Calculation
We are going to use a two-stage DCF model, which, as the name states, takes into account two stages of growth. The first stage is generally a higher growth period which levels off heading towards the terminal value, captured in the second 'steady growth' period. To start off with, we need to estimate the next ten years of cash flows. Where possible we use analyst estimates, but when these aren't available we extrapolate the previous free cash flow (FCF) from the last estimate or reported value. We assume companies with shrinking free cash flow will slow their rate of shrinkage, and that companies with growing free cash flow will see their growth rate slow, over this period. We do this to reflect that growth tends to slow more in the early years than it does in later years.
Generally we assume that a dollar today is more valuable than a dollar in the future, so we need to discount the sum of these future cash flows to arrive at a present value estimate:
10-year free cash flow (FCF) estimate
| 2023 | 2024 | 2025 | 2026 | 2027 | 2028 | 2029 | 2030 | 2031 | 2032 | |
| Levered FCF ($, Millions) | US$56.7m | US$228.0m | US$156.0m | US$119.1m | US$100.0m | US$89.4m | US$83.1m | US$79.5m | US$77.5m | US$76.6m |
| Growth Rate Estimate Source | Analyst x5 | Analyst x4 | Analyst x1 | Est @ -23.64% | Est @ -16.02% | Est @ -10.68% | Est @ -6.95% | Est @ -4.34% | Est @ -2.51% | Est @ -1.23% |
| Present Value ($, Millions) Discounted @ 9.1% | US$51.9 | US$191 | US$120 | US$84.0 | US$64.6 | US$52.9 | US$45.1 | US$39.5 | US$35.3 | US$32.0 |
("Est" = FCF growth rate estimated by Simply Wall St)
Present Value of 10-year Cash Flow (PVCF) = US$717m
We now need to calculate the Terminal Value, which accounts for all the future cash flows after this ten year period. The Gordon Growth formula is used to calculate Terminal Value at a future annual growth rate equal to the 5-year average of the 10-year government bond yield of 1.8%. We discount the terminal cash flows to today's value at a cost of equity of 9.1%.
Terminal Value (TV)= FCF2032 × (1 + g) ÷ (r – g) = US$77m× (1 + 1.8%) ÷ (9.1%– 1.8%) = US$1.1b
Present Value of Terminal Value (PVTV)= TV / (1 + r)10= US$1.1b÷ ( 1 + 9.1%)10= US$441m
The total value, or equity value, is then the sum of the present value of the future cash flows, which in this case is US$1.2b. In the final step we divide the equity value by the number of shares outstanding. Relative to the current share price of CA$4.3, the company appears a touch undervalued at a 20% discount to where the stock price trades currently. The assumptions in any calculation have a big impact on the valuation, so it is better to view this as a rough estimate, not precise down to the last cent.
Important Assumptions
We would point out that the most important inputs to a discounted cash flow are the discount rate and of course the actual cash flows. If you don't agree with these result, have a go at the calculation yourself and play with the assumptions. The DCF also does not consider the possible cyclicality of an industry, or a company's future capital requirements, so it does not give a full picture of a company's potential performance. Given that we are looking at Fortuna Silver Mines as potential shareholders, the cost of equity is used as the discount rate, rather than the cost of capital (or weighted average cost of capital, WACC) which accounts for debt. In this calculation we've used 9.1%, which is based on a levered beta of 1.242. Beta is a measure of a stock's volatility, compared to the market as a whole. We get our beta from the industry average beta of globally comparable companies, with an imposed limit between 0.8 and 2.0, which is a reasonable range for a stable business.
SWOT Analysis for Fortuna Silver Mines
Strength
- Debt is not viewed as a risk.
Weakness
- Earnings declined over the past year.
Opportunity
- Annual earnings are forecast to grow faster than the Canadian market.
- Trading below our estimate of fair value by more than 20%.
Threat
- Annual revenue is expected to decline over the next 4 years.
Next Steps:
Valuation is only one side of the coin in terms of building your investment thesis, and it is only one of many factors that you need to assess for a company. It's not possible to obtain a foolproof valuation with a DCF model. Preferably you'd apply different cases and assumptions and see how they would impact the company's valuation. For example, changes in the company's cost of equity or the risk free rate can significantly impact the valuation. What is the reason for the share price sitting below the intrinsic value? For Fortuna Silver Mines, there are three important factors you should consider:
- Risks: Case in point, we've spotted 1 warning sign for Fortuna Silver Mines you should be aware of.
- Future Earnings: How does FVI's growth rate compare to its peers and the wider market? Dig deeper into the analyst consensus number for the upcoming years by interacting with our free analyst growth expectation chart.
- Other Solid Businesses: Low debt, high returns on equity and good past performance are fundamental to a strong business. Why not explore our interactive list of stocks with solid business fundamentals to see if there are other companies you may not have considered!
PS. Simply Wall St updates its DCF calculation for every Canadian stock every day, so if you want to find the intrinsic value of any other stock just search here.
New: AI Stock Screener & Alerts
Our new AI Stock Screener scans the market every day to uncover opportunities.
• Dividend Powerhouses (3%+ Yield)
• Undervalued Small Caps with Insider Buying
• High growth Tech and AI Companies
Or build your own from over 50 metrics.
Have feedback on this article? Concerned about the content? Get in touch with us directly. Alternatively, email editorial-team (at) simplywallst.com.
This article by Simply Wall St is general in nature. We provide commentary based on historical data and analyst forecasts only using an unbiased methodology and our articles are not intended to be financial advice. It does not constitute a recommendation to buy or sell any stock, and does not take account of your objectives, or your financial situation. We aim to bring you long-term focused analysis driven by fundamental data. Note that our analysis may not factor in the latest price-sensitive company announcements or qualitative material. Simply Wall St has no position in any stocks mentioned.
About TSX:FVI
Fortuna Mining
Engages in the precious and base metal mining and related activities in Argentina, Burkina Faso, Côte d’Ivoire, Mexico, Peru, and Senegal.
Flawless balance sheet and good value.
Similar Companies
Market Insights

Advertisement
Community Narratives
MicroStrategy: Volatile Gamble or Golden Opportunity?
Fair Value US$663.00|36.2% undervalued
BL
Community Contributor
Emerging Markets and Debt Reduction Will Propel Bath & Body Works Forward
Fair Value US$40.73|22.0% undervalued
ZW
Community Contributor
An amazing opportunity to potentially get a 100 bagger
Fair Value US$10.00|46.4% overvalued
DA
Community Contributor