Is Premium Brands Holdings Corporation (TSE:PBH) Trading At A 30% Discount?


Key Insights
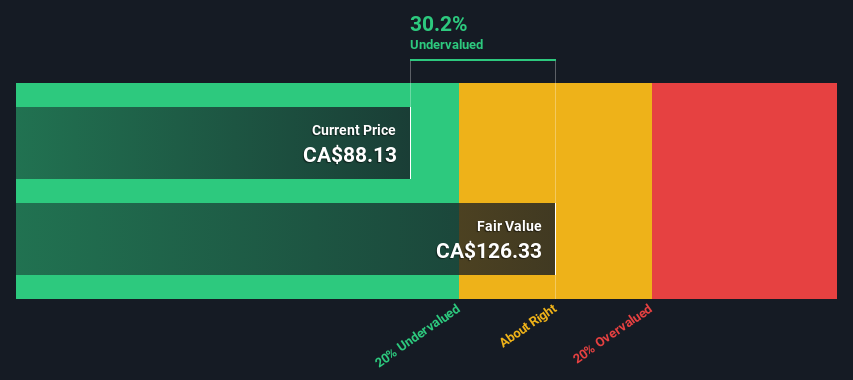
- The projected fair value for Premium Brands Holdings is CA$126 based on 2 Stage Free Cash Flow to Equity
- Current share price of CA$88.13 suggests Premium Brands Holdings is potentially 30% undervalued
- The CA$111 analyst price target for PBH is 12% less than our estimate of fair value
In this article we are going to estimate the intrinsic value of Premium Brands Holdings Corporation (TSE:PBH) by taking the expected future cash flows and discounting them to today's value. One way to achieve this is by employing the Discounted Cash Flow (DCF) model. There's really not all that much to it, even though it might appear quite complex.
We would caution that there are many ways of valuing a company and, like the DCF, each technique has advantages and disadvantages in certain scenarios. Anyone interested in learning a bit more about intrinsic value should have a read of the Simply Wall St analysis model.
Check out our latest analysis for Premium Brands Holdings
The Calculation
We're using the 2-stage growth model, which simply means we take in account two stages of company's growth. In the initial period the company may have a higher growth rate and the second stage is usually assumed to have a stable growth rate. In the first stage we need to estimate the cash flows to the business over the next ten years. Where possible we use analyst estimates, but when these aren't available we extrapolate the previous free cash flow (FCF) from the last estimate or reported value. We assume companies with shrinking free cash flow will slow their rate of shrinkage, and that companies with growing free cash flow will see their growth rate slow, over this period. We do this to reflect that growth tends to slow more in the early years than it does in later years.
A DCF is all about the idea that a dollar in the future is less valuable than a dollar today, so we need to discount the sum of these future cash flows to arrive at a present value estimate:
10-year free cash flow (FCF) estimate
| 2024 | 2025 | 2026 | 2027 | 2028 | 2029 | 2030 | 2031 | 2032 | 2033 | |
| Levered FCF (CA$, Millions) | CA$42.5m | CA$183.0m | CA$198.9m | CA$212.2m | CA$223.5m | CA$233.2m | CA$241.8m | CA$249.5m | CA$256.6m | CA$263.4m |
| Growth Rate Estimate Source | Analyst x2 | Analyst x2 | Est @ 8.69% | Est @ 6.70% | Est @ 5.32% | Est @ 4.35% | Est @ 3.67% | Est @ 3.19% | Est @ 2.86% | Est @ 2.62% |
| Present Value (CA$, Millions) Discounted @ 5.8% | CA$40.2 | CA$163 | CA$168 | CA$169 | CA$169 | CA$166 | CA$163 | CA$159 | CA$154 | CA$150 |
("Est" = FCF growth rate estimated by Simply Wall St)
Present Value of 10-year Cash Flow (PVCF) = CA$1.5b
We now need to calculate the Terminal Value, which accounts for all the future cash flows after this ten year period. For a number of reasons a very conservative growth rate is used that cannot exceed that of a country's GDP growth. In this case we have used the 5-year average of the 10-year government bond yield (2.1%) to estimate future growth. In the same way as with the 10-year 'growth' period, we discount future cash flows to today's value, using a cost of equity of 5.8%.
Terminal Value (TV)= FCF2033 × (1 + g) ÷ (r – g) = CA$263m× (1 + 2.1%) ÷ (5.8%– 2.1%) = CA$7.2b
Present Value of Terminal Value (PVTV)= TV / (1 + r)10= CA$7.2b÷ ( 1 + 5.8%)10= CA$4.1b
The total value, or equity value, is then the sum of the present value of the future cash flows, which in this case is CA$5.6b. The last step is to then divide the equity value by the number of shares outstanding. Compared to the current share price of CA$88.1, the company appears quite undervalued at a 30% discount to where the stock price trades currently. The assumptions in any calculation have a big impact on the valuation, so it is better to view this as a rough estimate, not precise down to the last cent.
Important Assumptions
We would point out that the most important inputs to a discounted cash flow are the discount rate and of course the actual cash flows. Part of investing is coming up with your own evaluation of a company's future performance, so try the calculation yourself and check your own assumptions. The DCF also does not consider the possible cyclicality of an industry, or a company's future capital requirements, so it does not give a full picture of a company's potential performance. Given that we are looking at Premium Brands Holdings as potential shareholders, the cost of equity is used as the discount rate, rather than the cost of capital (or weighted average cost of capital, WACC) which accounts for debt. In this calculation we've used 5.8%, which is based on a levered beta of 0.809. Beta is a measure of a stock's volatility, compared to the market as a whole. We get our beta from the industry average beta of globally comparable companies, with an imposed limit between 0.8 and 2.0, which is a reasonable range for a stable business.
SWOT Analysis for Premium Brands Holdings
- Debt is well covered by cash flow.
- Earnings declined over the past year.
- Interest payments on debt are not well covered.
- Dividend is low compared to the top 25% of dividend payers in the Food market.
- Annual earnings are forecast to grow faster than the Canadian market.
- Good value based on P/E ratio and estimated fair value.
- Dividends are not covered by earnings and cashflows.
- Revenue is forecast to grow slower than 20% per year.
Next Steps:
Valuation is only one side of the coin in terms of building your investment thesis, and it shouldn't be the only metric you look at when researching a company. The DCF model is not a perfect stock valuation tool. Preferably you'd apply different cases and assumptions and see how they would impact the company's valuation. If a company grows at a different rate, or if its cost of equity or risk free rate changes sharply, the output can look very different. Why is the intrinsic value higher than the current share price? For Premium Brands Holdings, there are three further factors you should consider:
- Risks: You should be aware of the 3 warning signs for Premium Brands Holdings (2 don't sit too well with us!) we've uncovered before considering an investment in the company.
- Future Earnings: How does PBH's growth rate compare to its peers and the wider market? Dig deeper into the analyst consensus number for the upcoming years by interacting with our free analyst growth expectation chart.
- Other High Quality Alternatives: Do you like a good all-rounder? Explore our interactive list of high quality stocks to get an idea of what else is out there you may be missing!
PS. The Simply Wall St app conducts a discounted cash flow valuation for every stock on the TSX every day. If you want to find the calculation for other stocks just search here.
New: Manage All Your Stock Portfolios in One Place
We've created the ultimate portfolio companion for stock investors, and it's free.
• Connect an unlimited number of Portfolios and see your total in one currency
• Be alerted to new Warning Signs or Risks via email or mobile
• Track the Fair Value of your stocks
Have feedback on this article? Concerned about the content? Get in touch with us directly. Alternatively, email editorial-team (at) simplywallst.com.
This article by Simply Wall St is general in nature. We provide commentary based on historical data and analyst forecasts only using an unbiased methodology and our articles are not intended to be financial advice. It does not constitute a recommendation to buy or sell any stock, and does not take account of your objectives, or your financial situation. We aim to bring you long-term focused analysis driven by fundamental data. Note that our analysis may not factor in the latest price-sensitive company announcements or qualitative material. Simply Wall St has no position in any stocks mentioned.
About TSX:PBH
Premium Brands Holdings
Through its subsidiaries, manufactures and distributes food products primarily in Canada and the United States.
Reasonable growth potential and fair value.
Market Insights

Community Narratives

