
Advertisement
- Canada
- /
- Oil and Gas
- /
- TSX:TXP
Even though Touchstone Exploration (TSE:TXP) has lost CA$28m market cap in last 7 days, shareholders are still up 187% over 5 years

The last three months have been tough on Touchstone Exploration Inc. (TSE:TXP) shareholders, who have seen the share price decline a rather worrying 33%. But in stark contrast, the returns over the last half decade have impressed. Indeed, the share price is up an impressive 187% in that time. To some, the recent pullback wouldn't be surprising after such a fast rise. Ultimately business performance will determine whether the stock price continues the positive long term trend. Unfortunately not all shareholders will have held it for five years, so spare a thought for those caught in the 47% decline over the last three years: that's a long time to wait for profits.
While this past week has detracted from the company's five-year return, let's look at the recent trends of the underlying business and see if the gains have been in alignment.
See our latest analysis for Touchstone Exploration
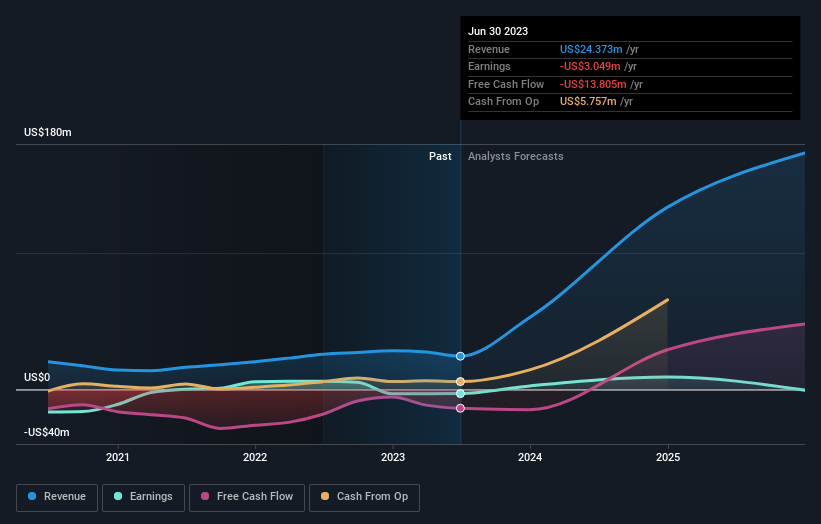
Touchstone Exploration isn't currently profitable, so most analysts would look to revenue growth to get an idea of how fast the underlying business is growing. When a company doesn't make profits, we'd generally expect to see good revenue growth. As you can imagine, fast revenue growth, when maintained, often leads to fast profit growth.
Over the last half decade Touchstone Exploration's revenue has actually been trending down at about 1.9% per year. On the other hand, the share price done the opposite, gaining 23%, compound, each year. It's a good reminder that expectations about the future, not the past history, always impact share prices. Still, we are a bit cautious in this kind of situation.
The graphic below depicts how earnings and revenue have changed over time (unveil the exact values by clicking on the image).
If you are thinking of buying or selling Touchstone Exploration stock, you should check out this FREE detailed report on its balance sheet.
A Different Perspective
While the broader market gained around 2.9% in the last year, Touchstone Exploration shareholders lost 18%. Even the share prices of good stocks drop sometimes, but we want to see improvements in the fundamental metrics of a business, before getting too interested. Longer term investors wouldn't be so upset, since they would have made 23%, each year, over five years. It could be that the recent sell-off is an opportunity, so it may be worth checking the fundamental data for signs of a long term growth trend. It's always interesting to track share price performance over the longer term. But to understand Touchstone Exploration better, we need to consider many other factors. Even so, be aware that Touchstone Exploration is showing 2 warning signs in our investment analysis , you should know about...
If you like to buy stocks alongside management, then you might just love this free list of companies. (Hint: insiders have been buying them).
Please note, the market returns quoted in this article reflect the market weighted average returns of stocks that currently trade on Canadian exchanges.
Valuation is complex, but we're here to simplify it.
Discover if Touchstone Exploration might be undervalued or overvalued with our detailed analysis, featuring fair value estimates, potential risks, dividends, insider trades, and its financial condition.
Access Free AnalysisHave feedback on this article? Concerned about the content? Get in touch with us directly. Alternatively, email editorial-team (at) simplywallst.com.
This article by Simply Wall St is general in nature. We provide commentary based on historical data and analyst forecasts only using an unbiased methodology and our articles are not intended to be financial advice. It does not constitute a recommendation to buy or sell any stock, and does not take account of your objectives, or your financial situation. We aim to bring you long-term focused analysis driven by fundamental data. Note that our analysis may not factor in the latest price-sensitive company announcements or qualitative material. Simply Wall St has no position in any stocks mentioned.
About TSX:TXP
Touchstone Exploration
Engages in the exploration, development, acquisition, production, and sale of petroleum and natural gas properties in the Republic of Trinidad and Tobago.
Slightly overvalued with limited growth.
Market Insights


Advertisement
Community Narratives
The Future of Drug Testing? Fingerprint Tech Shows Serious Promise
Fair Value US$2.98|40.3% undervalued
JO
Community Contributor
Suncorp’s Next Chapter: Insurance-Only and Ready to Grow
Fair Value AU$22.83|7.6% undervalued
RO
Community Contributor
Thyssenkrupp Nucera Will Achieve Double-Digit Profits by 2030 Boosted by Hydrogen Growth
Fair Value €14.40|30.6% undervalued
CH
Community Contributor
Tesla’s Nvidia Moment – The AI & Robotics Inflection Point
Fair Value US$359.72|12.3% undervalued
BL
Community Contributor