Advertisement
- Canada
- /
- Oil and Gas
- /
- TSX:TRP
Has TC Energy’s Stock Price Run Ahead After Keystone Pipeline Update in 2025?

Simply Wall St
Reviewed by Bailey Pemberton
If you’re keeping an eye on TC Energy, you’re not alone. With stock prices moving from a slight dip this week to a strong climb over the past year, a lot of investors are asking the same question: is it still worth jumping in now, or should you wait for a better entry point? The stock closed at $72.10 and despite a one-week slide of -2.5%, it’s up an impressive 14.0% over the last year, and nearly doubled over five. That’s not just random movement. The company sits in the middle of some major North American infrastructure conversations, and investors have reacted as new energy project approvals and market demand have shifted expectations for its long-term potential.
Of course, hype and hope are one thing, but smart investing means asking if TC Energy is actually undervalued. Looking at the numbers, the company checks just one box out of six for being undervalued, resulting in a value score of 1. That might leave you wondering if the easy gains have already been made, or if there’s something the market is missing.
Next, we’ll break down the different valuation approaches that analysts use to measure TC Energy’s potential. Stick around, because at the end of the article, we’ll talk about a perspective that can change how you think about “undervalued” altogether.
TC Energy scores just 1/6 on our valuation checks. See what other red flags we found in the full valuation breakdown.
Approach 1: TC Energy Discounted Cash Flow (DCF) Analysis
The Discounted Cash Flow (DCF) model is a widely used method for estimating a company's intrinsic value. It works by projecting future cash flows, essentially the money TC Energy expects to generate in coming years, and then "discounting" those amounts back to what they are worth today. This gives investors a way to put a present-day value on streams of profit that will arrive much further down the line.
For TC Energy, the DCF analysis starts with the most recent annual Free Cash Flow (FCF), which came in at CA$380.8 Million. Analyst estimates for the next five years suggest continued growth, with Simply Wall St further extrapolating these projections out to ten years. According to these projections, TC Energy's annual FCF could rise to roughly CA$2.04 Billion by 2029, and continue trending near CA$1.6 Billion in the decade ahead.
When all future cash flows are added up and discounted to present value, the intrinsic worth of TC Energy is calculated at CA$31.81 per share. Compared to the current share price of CA$72.10, this suggests the stock is trading at a 126.6% premium to its DCF-implied value.
Result: OVERVALUED
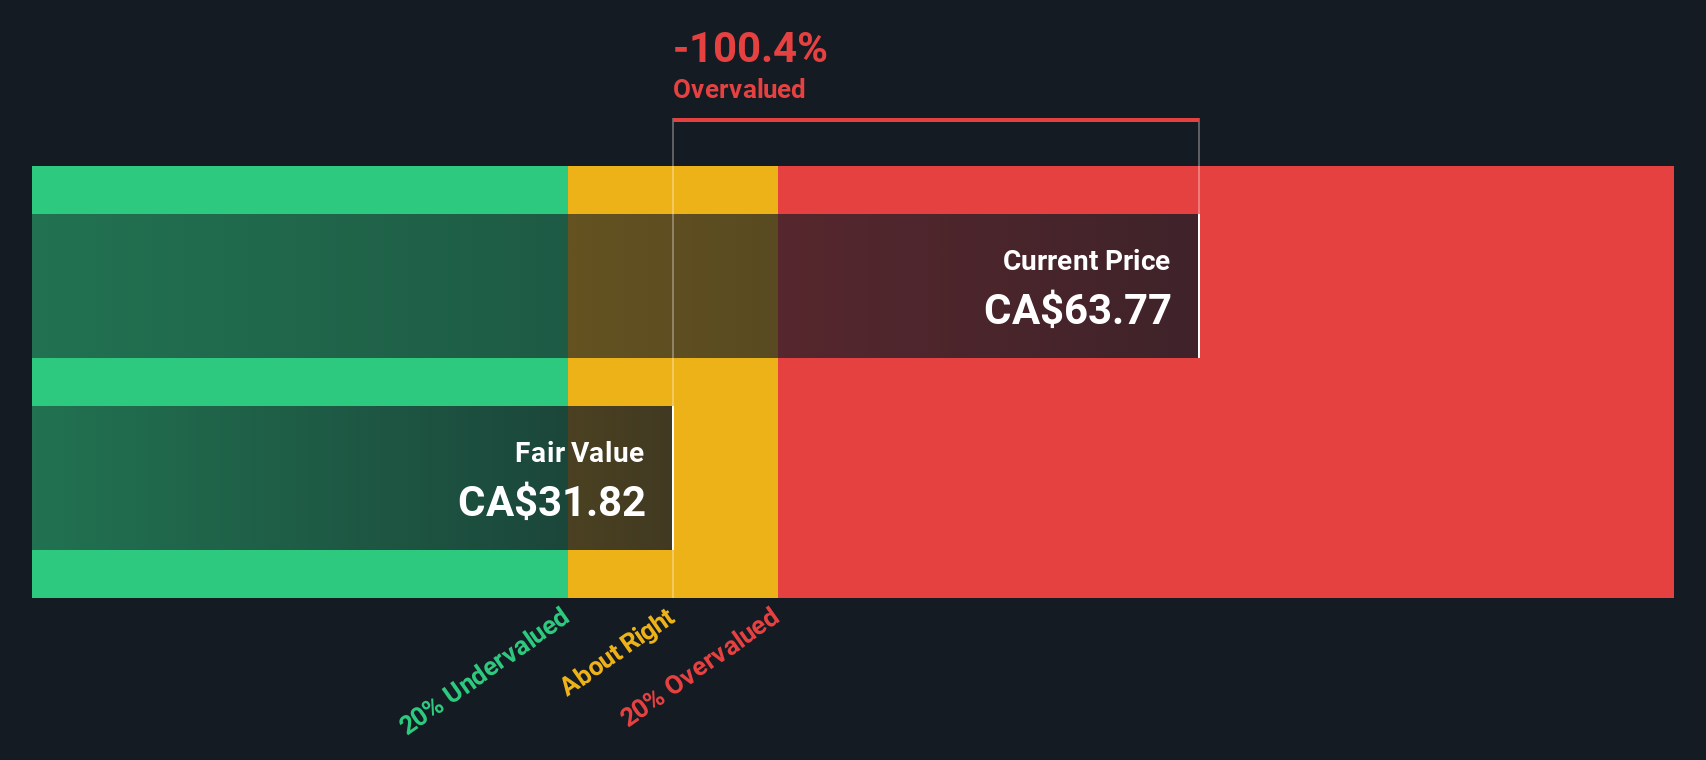
Our Discounted Cash Flow (DCF) analysis suggests TC Energy may be overvalued by 126.6%. Find undervalued stocks or create your own screener to find better value opportunities.
Approach 2: TC Energy Price vs Earnings (PE Ratio)
The Price-to-Earnings (PE) ratio is a go-to metric for evaluating profitable companies such as TC Energy. It shows how much investors are willing to pay today for each dollar of company earnings, making it especially relevant for businesses with steady profits. Since TC Energy has positive earnings, using the PE ratio is a clear way to benchmark how the market currently values its income against competitors.
The “right” PE ratio can vary based on both growth expectations and the risks facing the business. Generally, investors are willing to pay a higher multiple for companies with stronger growth prospects, more reliable income, or lower perceived risks. Conversely, higher risks or weaker outlooks push the typical ratio down.
As of now, TC Energy trades at a PE ratio of 17.66x. That is higher than the Oil and Gas industry average of 11.97x but slightly below the average for similar peers, which comes in at 19.41x. Simply Wall St’s Fair Ratio, a proprietary calculation factoring in the company’s earnings growth, risk profile, profit margins, industry, and market cap, lands at 15.77x. The Fair Ratio offers a more tailored benchmark than simply looking at industry or peer averages, as it captures realities specific to TC Energy and its prospects.
Comparing the Fair Ratio to the company’s actual PE, TC Energy is currently trading a little above its calculated fair value, but not by a wide margin. The numbers suggest the stock is roughly in line with where it should be valued relative to its fundamentals.
Result: ABOUT RIGHT

PE ratios tell one story, but what if the real opportunity lies elsewhere? Discover companies where insiders are betting big on explosive growth.
Upgrade Your Decision Making: Choose your TC Energy Narrative
Earlier we mentioned that there is an even better way to understand valuation, so let's introduce you to Narratives. A Narrative is a simple, powerful tool where you blend your view of a company's story, combining everything you believe about TC Energy's future prospects, risks, and industry changes into your own forecast for its revenue, profits, and fair value.
Narratives connect a company’s real-world events to a financial outlook, linking your personal expectations to a fair value calculation so you can quickly see if a stock is priced for optimism, caution, or something in between. On Simply Wall St’s Community page, millions of investors use Narratives because they are easy to update with the latest company news, earnings, or trends. This helps ensure your investment viewpoint reflects current realities.
By comparing your Narrative’s fair value to the actual share price, you get a dynamic way to decide if and when to buy or sell instead of relying solely on static ratios or outdated analyst opinions. For instance, some investors believe TC Energy is undervalued with a fair value above CA$80, reflecting strong demand for gas infrastructure. Others see risks from decarbonization trends and value it closer to CA$59. Narratives help you capture these differences and give you a practical edge in your decision making.
Do you think there's more to the story for TC Energy? Create your own Narrative to let the Community know!
This article by Simply Wall St is general in nature. We provide commentary based on historical data and analyst forecasts only using an unbiased methodology and our articles are not intended to be financial advice. It does not constitute a recommendation to buy or sell any stock, and does not take account of your objectives, or your financial situation. We aim to bring you long-term focused analysis driven by fundamental data. Note that our analysis may not factor in the latest price-sensitive company announcements or qualitative material. Simply Wall St has no position in any stocks mentioned.
Valuation is complex, but we're here to simplify it.
Discover if TC Energy might be undervalued or overvalued with our detailed analysis, featuring fair value estimates, potential risks, dividends, insider trades, and its financial condition.
Access Free AnalysisHave feedback on this article? Concerned about the content? Get in touch with us directly. Alternatively, email editorial-team@simplywallst.com
About TSX:TRP
Proven track record second-rate dividend payer.
Similar Companies
Market Insights

Advertisement
Community Narratives
Kodiak AI - a potential 100 bagger opportunity?
Fair Value US$14.00|44.7% undervalued
DA
Community Contributor
A Fair Price for a Great Business Facing Real Threats
Fair Value US$383.06|13.0% undervalued
IM
Community Contributor
AXON And Shopify Integration Will Unlock Global Mobile Advertising
Fair Value US$646.30|0% overvalued
AN
Based on Analyst Price Targets