- Canada
- /
- Energy Services
- /
- TSX:STEP
Is STEP Energy Services Ltd.'s (TSE:STEP) Latest Stock Performance A Reflection Of Its Financial Health?


STEP Energy Services (TSE:STEP) has had a great run on the share market with its stock up by a significant 13% over the last month. Given the company's impressive performance, we decided to study its financial indicators more closely as a company's financial health over the long-term usually dictates market outcomes. Particularly, we will be paying attention to STEP Energy Services' ROE today.
Return on equity or ROE is a key measure used to assess how efficiently a company's management is utilizing the company's capital. In short, ROE shows the profit each dollar generates with respect to its shareholder investments.
See our latest analysis for STEP Energy Services
How To Calculate Return On Equity?
The formula for ROE is:
Return on Equity = Net Profit (from continuing operations) ÷ Shareholders' Equity
So, based on the above formula, the ROE for STEP Energy Services is:
20% = CA$72m ÷ CA$366m (Based on the trailing twelve months to September 2023).
The 'return' is the profit over the last twelve months. That means that for every CA$1 worth of shareholders' equity, the company generated CA$0.20 in profit.
What Has ROE Got To Do With Earnings Growth?
So far, we've learned that ROE is a measure of a company's profitability. We now need to evaluate how much profit the company reinvests or "retains" for future growth which then gives us an idea about the growth potential of the company. Generally speaking, other things being equal, firms with a high return on equity and profit retention, have a higher growth rate than firms that don’t share these attributes.
A Side By Side comparison of STEP Energy Services' Earnings Growth And 20% ROE
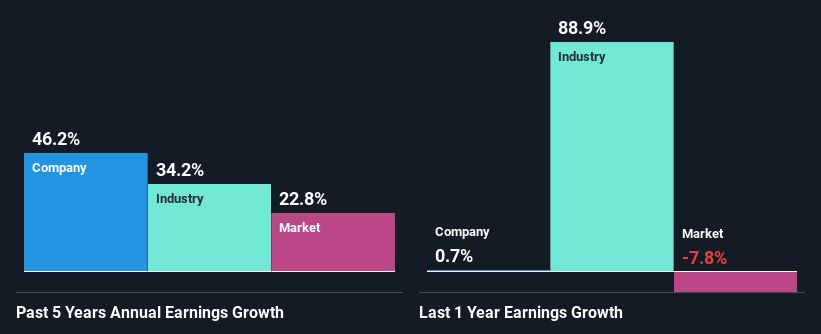
At first glance, STEP Energy Services seems to have a decent ROE. And on comparing with the industry, we found that the the average industry ROE is similar at 20%. This certainly adds some context to STEP Energy Services' exceptional 46% net income growth seen over the past five years. However, there could also be other drivers behind this growth. For instance, the company has a low payout ratio or is being managed efficiently.
As a next step, we compared STEP Energy Services' net income growth with the industry, and pleasingly, we found that the growth seen by the company is higher than the average industry growth of 34%.
Earnings growth is an important metric to consider when valuing a stock. It’s important for an investor to know whether the market has priced in the company's expected earnings growth (or decline). By doing so, they will have an idea if the stock is headed into clear blue waters or if swampy waters await. Has the market priced in the future outlook for STEP? You can find out in our latest intrinsic value infographic research report.
Is STEP Energy Services Efficiently Re-investing Its Profits?
Given that STEP Energy Services doesn't pay any dividend to its shareholders, we infer that the company has been reinvesting all of its profits to grow its business.
Conclusion
On the whole, we feel that STEP Energy Services' performance has been quite good. Specifically, we like that the company is reinvesting a huge chunk of its profits at a high rate of return. This of course has caused the company to see substantial growth in its earnings. That being so, according to the latest industry analyst forecasts, the company's earnings are expected to shrink in the future. To know more about the company's future earnings growth forecasts take a look at this free report on analyst forecasts for the company to find out more.
New: Manage All Your Stock Portfolios in One Place
We've created the ultimate portfolio companion for stock investors, and it's free.
• Connect an unlimited number of Portfolios and see your total in one currency
• Be alerted to new Warning Signs or Risks via email or mobile
• Track the Fair Value of your stocks
Have feedback on this article? Concerned about the content? Get in touch with us directly. Alternatively, email editorial-team (at) simplywallst.com.
This article by Simply Wall St is general in nature. We provide commentary based on historical data and analyst forecasts only using an unbiased methodology and our articles are not intended to be financial advice. It does not constitute a recommendation to buy or sell any stock, and does not take account of your objectives, or your financial situation. We aim to bring you long-term focused analysis driven by fundamental data. Note that our analysis may not factor in the latest price-sensitive company announcements or qualitative material. Simply Wall St has no position in any stocks mentioned.
About TSX:STEP
STEP Energy Services
An energy services company, provides integrated coiled tubing, fluid and nitrogen pumping, and hydraulic fracturing to service oil and natural gas industry in Canada and the United States.
Flawless balance sheet and undervalued.
