- Canada
- /
- Oil and Gas
- /
- TSX:KEL
Do Its Financials Have Any Role To Play In Driving Kelt Exploration Ltd.'s (TSE:KEL) Stock Up Recently?


Kelt Exploration (TSE:KEL) has had a great run on the share market with its stock up by a significant 9.7% over the last month. Given that stock prices are usually aligned with a company's financial performance in the long-term, we decided to study its financial indicators more closely to see if they had a hand to play in the recent price move. Particularly, we will be paying attention to Kelt Exploration's ROE today.
Return on Equity or ROE is a test of how effectively a company is growing its value and managing investors’ money. In other words, it is a profitability ratio which measures the rate of return on the capital provided by the company's shareholders.
See our latest analysis for Kelt Exploration
How Is ROE Calculated?
The formula for ROE is:
Return on Equity = Net Profit (from continuing operations) ÷ Shareholders' Equity
So, based on the above formula, the ROE for Kelt Exploration is:
6.4% = CA$67m ÷ CA$1.0b (Based on the trailing twelve months to June 2024).
The 'return' is the yearly profit. One way to conceptualize this is that for each CA$1 of shareholders' capital it has, the company made CA$0.06 in profit.
What Is The Relationship Between ROE And Earnings Growth?
So far, we've learned that ROE is a measure of a company's profitability. Depending on how much of these profits the company reinvests or "retains", and how effectively it does so, we are then able to assess a company’s earnings growth potential. Assuming all else is equal, companies that have both a higher return on equity and higher profit retention are usually the ones that have a higher growth rate when compared to companies that don't have the same features.
Kelt Exploration's Earnings Growth And 6.4% ROE
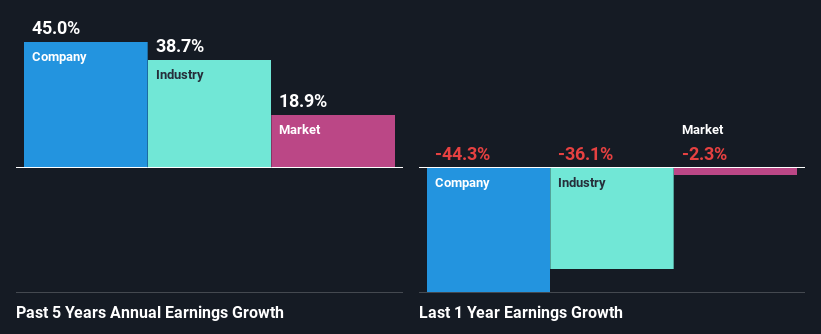
When you first look at it, Kelt Exploration's ROE doesn't look that attractive. A quick further study shows that the company's ROE doesn't compare favorably to the industry average of 9.7% either. However, we we're pleasantly surprised to see that Kelt Exploration grew its net income at a significant rate of 45% in the last five years. Therefore, there could be other reasons behind this growth. Such as - high earnings retention or an efficient management in place.
We then performed a comparison between Kelt Exploration's net income growth with the industry, which revealed that the company's growth is similar to the average industry growth of 39% in the same 5-year period.
Earnings growth is a huge factor in stock valuation. It’s important for an investor to know whether the market has priced in the company's expected earnings growth (or decline). By doing so, they will have an idea if the stock is headed into clear blue waters or if swampy waters await. Is KEL fairly valued? This infographic on the company's intrinsic value has everything you need to know.
Is Kelt Exploration Making Efficient Use Of Its Profits?
Kelt Exploration doesn't pay any regular dividends to its shareholders, meaning that the company has been reinvesting all of its profits into the business. This is likely what's driving the high earnings growth number discussed above.
Summary
On the whole, we do feel that Kelt Exploration has some positive attributes. With a high rate of reinvestment, albeit at a low ROE, the company has managed to see a considerable growth in its earnings. While we won't completely dismiss the company, what we would do, is try to ascertain how risky the business is to make a more informed decision around the company. You can see the 1 risk we have identified for Kelt Exploration by visiting our risks dashboard for free on our platform here.
Valuation is complex, but we're here to simplify it.
Discover if Kelt Exploration might be undervalued or overvalued with our detailed analysis, featuring fair value estimates, potential risks, dividends, insider trades, and its financial condition.
Access Free AnalysisHave feedback on this article? Concerned about the content? Get in touch with us directly. Alternatively, email editorial-team (at) simplywallst.com.
This article by Simply Wall St is general in nature. We provide commentary based on historical data and analyst forecasts only using an unbiased methodology and our articles are not intended to be financial advice. It does not constitute a recommendation to buy or sell any stock, and does not take account of your objectives, or your financial situation. We aim to bring you long-term focused analysis driven by fundamental data. Note that our analysis may not factor in the latest price-sensitive company announcements or qualitative material. Simply Wall St has no position in any stocks mentioned.
About TSX:KEL
Kelt Exploration
An oil and gas company, engages in the exploration, development, and production of crude oil and natural gas resources primarily in Western Canada.
Adequate balance sheet and fair value.

