Advertisement
- Canada
- /
- Oil and Gas
- /
- TSX:CCO
Is Cameco Fully Priced After Its 70% Surge and Record Uranium Demand?

Simply Wall St
Reviewed by Bailey Pemberton
If you have been watching Cameco, you are not alone in wondering what to make of these incredible numbers. Over the last five years, the stock has soared more than 900%, and even in just the last year it climbed over 64%. This year alone, Cameco is up over 70%, a kind of sustained momentum that is hard to ignore, especially for investors weighing their next move. In the past week and month, gains of 5.2% and 16.1% respectively show just how resilient the stock has been, riding strong on a wave of optimism surrounding uranium demand and ongoing global energy shifts.
Of course, such rapid price appreciation can change how the market values a company. Investors are asking whether Cameco’s growth has already been priced in, or if there is still room to run. Based on common valuation methods, Cameco currently scores a 0 out of 6 on checks for being undervalued, suggesting that by these measurements, the stock may not be a bargain.
But are traditional valuation metrics really telling the full story here? Let’s explore a few of the most popular approaches, and later in the article, I will share a perspective that could be even more telling for anyone deciding what to do next with Cameco.
Cameco scores just 0/6 on our valuation checks. See what other red flags we found in the full valuation breakdown.
Approach 1: Cameco Discounted Cash Flow (DCF) Analysis
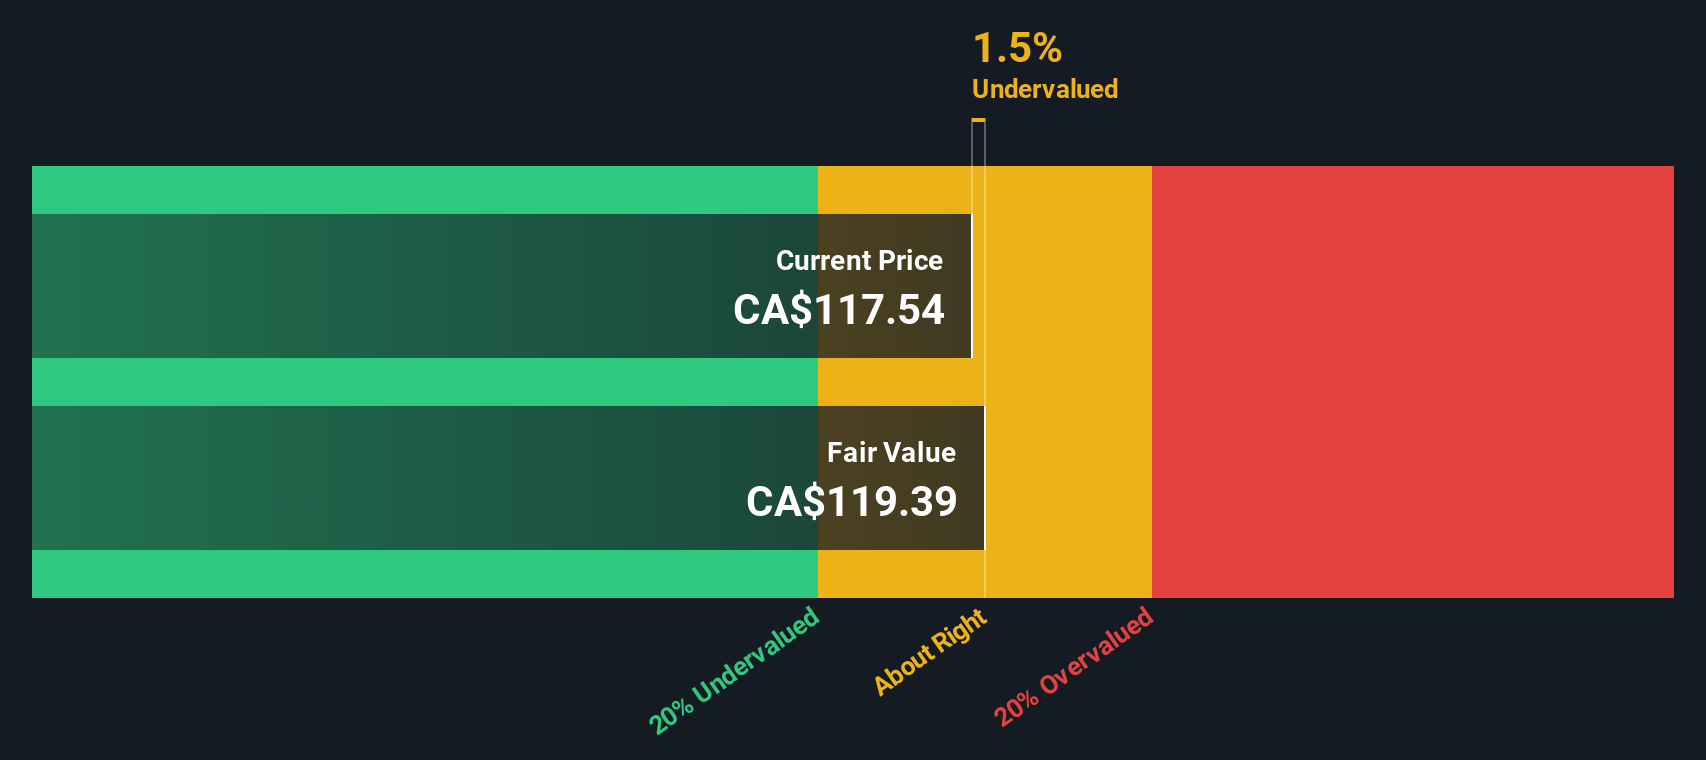
The Discounted Cash Flow (DCF) model takes Cameco’s expected future cash flows and calculates what they are worth in today’s dollars, helping investors judge whether the stock price reflects its true intrinsic value. For Cameco, this analysis is based on a two-stage model that incorporates both current estimates and longer-term projections.
Currently, Cameco’s Free Cash Flow is CA$910.6 million. Analysts have forecast robust growth, with Free Cash Flow expected to climb to CA$1.60 billion by 2029. Beyond the next five years, further projections are extrapolated to extend the outlook through to 2035. These figures reflect the industry’s anticipation that uranium demand, and with it, Cameco’s cash generation, will continue to rise over the coming decade.
Based on this substantial growth, the DCF model estimates Cameco’s intrinsic value at CA$119.32 per share. Compare that to the current share price, and you find the stock is trading about 7.3% above what the cash flow projections would justify. In practical terms, the DCF model suggests Cameco is slightly overvalued right now, but not dramatically so.
Result: ABOUT RIGHT
Simply Wall St performs a valuation analysis on every stock in the world every day (check out Cameco's valuation analysis). We show the entire calculation in full. You can track the result in your watchlist or portfolio and be alerted when this changes.
Approach 2: Cameco Price vs Earnings
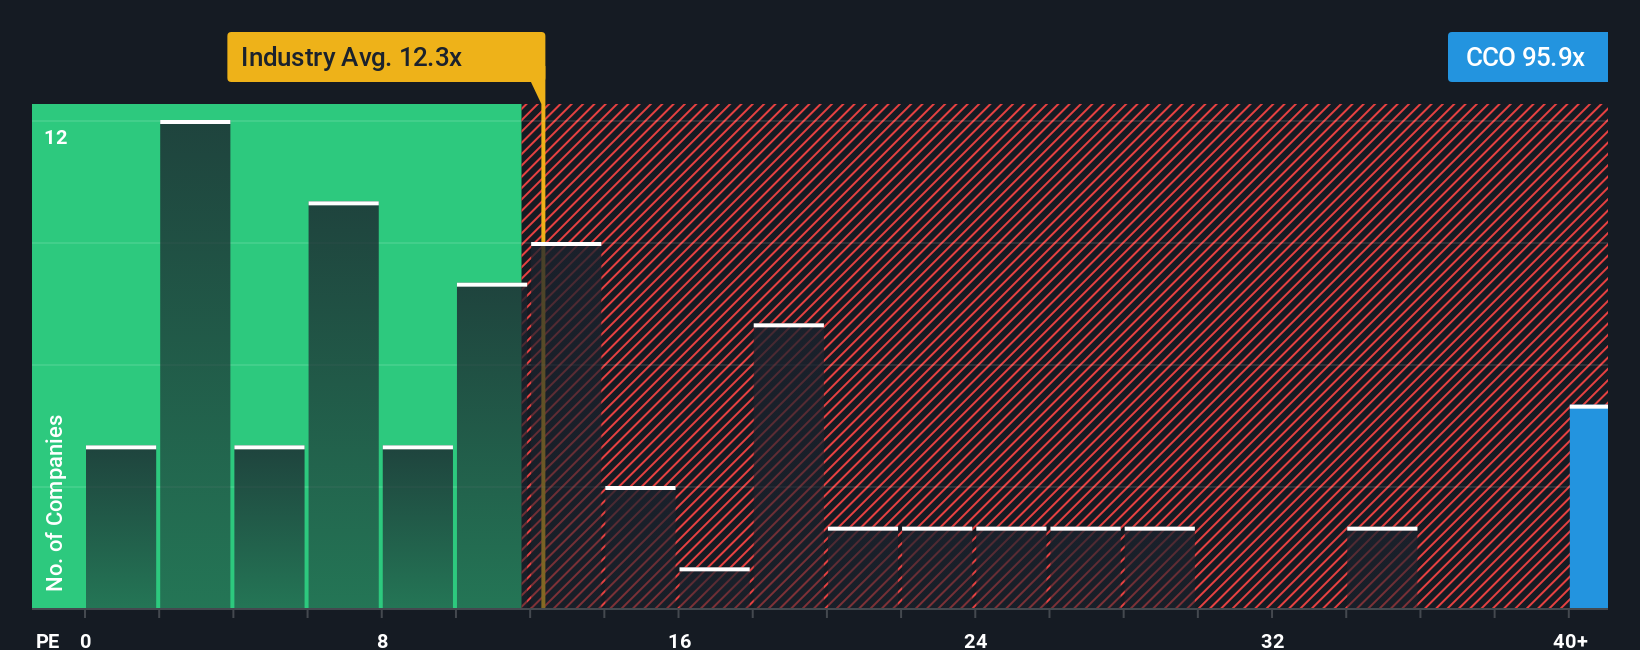
The Price-to-Earnings (P/E) ratio is a favored valuation metric for profitable companies because it shows how much investors are willing to pay for each dollar of a company’s earnings. When a company is growing steadily and generating consistent profits, the P/E ratio makes it easier to compare both its quality and price to sector peers and the broader market.
Growth prospects, market risks, and the predictability of earnings all play a role in influencing what a “normal” or “fair” P/E ratio should be. Higher growth companies often command higher P/E ratios, while increased risks tend to push those multiples lower. For Cameco, the current P/E ratio sits at a lofty 104.5x. For context, this is well above the Oil and Gas industry average of 12.0x and its peer average of 14.6x. This reflects the market’s strong optimism for Cameco’s outlook.
However, instead of only comparing Cameco’s P/E to industry or peer benchmarks, Simply Wall St uses a proprietary “Fair Ratio.” This measure goes beyond simple averages and factors in the company’s earnings growth, profit margins, industry characteristics, size, and risk profile to calculate what multiple the company should reasonably command. For Cameco, the Fair Ratio is 19.5x, significantly below the current P/E.
Based on this, Cameco is trading at a much higher P/E than what its fundamentals would warrant, even after accounting for its growth and sector dynamics.
Result: OVERVALUED
PE ratios tell one story, but what if the real opportunity lies elsewhere? Discover companies where insiders are betting big on explosive growth.
Upgrade Your Decision Making: Choose your Cameco Narrative
Earlier we mentioned that there's an even better way to understand valuation, so let's introduce you to Narratives. A Narrative is more than just a number; it’s your story and view of a company, where you connect your expectations and assumptions (such as future revenue, profit margins, and risks) to a financial forecast, and ultimately to your own fair value estimate.
On Simply Wall St’s Community page, Narratives make this process simple and accessible. Millions of investors use them to blend the “why” behind their outlook with the “how much” that outlook is worth. Narratives let you compare your Fair Value to the live market price, so you can quickly spot opportunities or identify when to be cautious. They update dynamically when key news or results are announced.
For example, with Cameco, one investor might focus on booming global nuclear demand and see a fair value near CA$131, while another could emphasize supply risks and set a fair value closer to CA$100. Both can build and adjust their Narratives as the story changes. Narratives empower you to connect the dots and act decisively, because your conviction is now built on a clear and adaptable framework.
Do you think there's more to the story for Cameco? Create your own Narrative to let the Community know!
This article by Simply Wall St is general in nature. We provide commentary based on historical data and analyst forecasts only using an unbiased methodology and our articles are not intended to be financial advice. It does not constitute a recommendation to buy or sell any stock, and does not take account of your objectives, or your financial situation. We aim to bring you long-term focused analysis driven by fundamental data. Note that our analysis may not factor in the latest price-sensitive company announcements or qualitative material. Simply Wall St has no position in any stocks mentioned.
New: AI Stock Screener & Alerts
Our new AI Stock Screener scans the market every day to uncover opportunities.
• Dividend Powerhouses (3%+ Yield)
• Undervalued Small Caps with Insider Buying
• High growth Tech and AI Companies
Or build your own from over 50 metrics.
Have feedback on this article? Concerned about the content? Get in touch with us directly. Alternatively, email editorial-team@simplywallst.com
About TSX:CCO
Solid track record with excellent balance sheet.
Similar Companies
Market Insights

Advertisement
Community Narratives
MicroVision will explode future revenue by 380.37% with a vision towards success
Fair Value US$60|98.4% undervalued
TH
Community Contributor
The Indispensable Artery for a New North American Economy
Fair Value CA$132.87|0.7% overvalued
TI
Community Contributor
Recently Updated Narratives
CO

composite32 on Astor Enerji ·
Astor Enerji will surge with a fair value of $140.43 in the next 3 years
Fair Value:₺140.4335.5% undervalued
1 followerusers have followed this narrative
0 commentsusers have commented on this narrative
0 likesusers have liked this narrative
RE

RecMag on Proximus ·
Proximus: The State-Backed Backup Plan with 7% Gross Yield and 15% Currency Upside.
Fair Value:€17.1356.7% undervalued
30 followersusers have followed this narrative
0 commentsusers have commented on this narrative
0 likesusers have liked this narrative
AG


Agricola on IMPACT Silver ·
A case for for IMPACT Silver Corp (TSXV:IPT) to reach USD $4.52 (CAD $6.16) in 2026 (23 bagger in 1 year) and USD $5.76 (CAD $7.89) by 2030
Fair Value:CA$7.8996.2% undervalued
1 followerusers have followed this narrative
0 commentsusers have commented on this narrative
0 likesusers have liked this narrative
Popular Narratives
TH

TheWallstreetKing on MicroVision ·
MicroVision will explode future revenue by 380.37% with a vision towards success
Fair Value:US$6098.4% undervalued
101 followersusers have followed this narrative
10 commentsusers have commented on this narrative
20 likesusers have liked this narrative
OS


oscargarcia on Alphabet ·
The company that turned a verb into a global necessity and basically runs the modern internet, digital ads, smartphones, maps, and AI.
Fair Value:US$3405.8% undervalued
138 followersusers have followed this narrative
6 commentsusers have commented on this narrative
18 likesusers have liked this narrative
AN


AnalystConsensusTarget on NVIDIA ·
NVDA: Expanding AI Demand Will Drive Major Data Center Investments Through 2026
Fair Value:US$250.3929.3% undervalued
930 followersusers have followed this narrative
6 commentsusers have commented on this narrative
23 likesusers have liked this narrative