- Canada
- /
- Oil and Gas
- /
- TSX:ARX
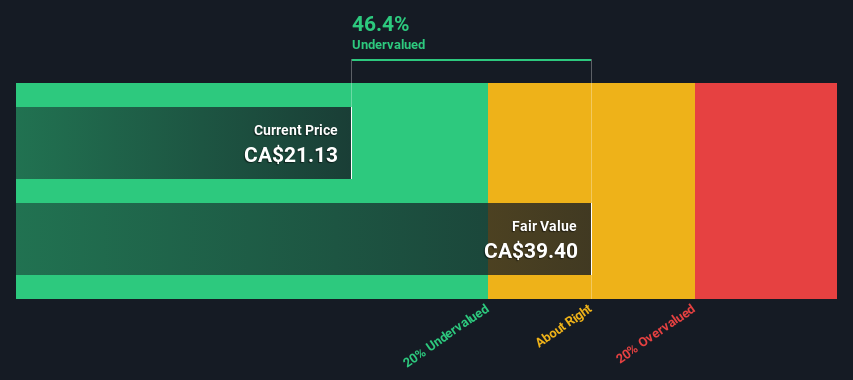
Is There An Opportunity With ARC Resources Ltd.'s (TSE:ARX) 46% Undervaluation?


Key Insights
- ARC Resources' estimated fair value is CA$39.40 based on 2 Stage Free Cash Flow to Equity
- ARC Resources' CA$21.13 share price signals that it might be 46% undervalued
- When compared to theindustry average discount to fair value of 22%, ARC Resources' competitors seem to be trading at a lesser discount
Does the January share price for ARC Resources Ltd. (TSE:ARX) reflect what it's really worth? Today, we will estimate the stock's intrinsic value by projecting its future cash flows and then discounting them to today's value. The Discounted Cash Flow (DCF) model is the tool we will apply to do this. It may sound complicated, but actually it is quite simple!
We generally believe that a company's value is the present value of all of the cash it will generate in the future. However, a DCF is just one valuation metric among many, and it is not without flaws. If you still have some burning questions about this type of valuation, take a look at the Simply Wall St analysis model.
Check out our latest analysis for ARC Resources
Step By Step Through The Calculation
We use what is known as a 2-stage model, which simply means we have two different periods of growth rates for the company's cash flows. Generally the first stage is higher growth, and the second stage is a lower growth phase. In the first stage we need to estimate the cash flows to the business over the next ten years. Where possible we use analyst estimates, but when these aren't available we extrapolate the previous free cash flow (FCF) from the last estimate or reported value. We assume companies with shrinking free cash flow will slow their rate of shrinkage, and that companies with growing free cash flow will see their growth rate slow, over this period. We do this to reflect that growth tends to slow more in the early years than it does in later years.
Generally we assume that a dollar today is more valuable than a dollar in the future, so we discount the value of these future cash flows to their estimated value in today's dollars:
10-year free cash flow (FCF) estimate
| 2024 | 2025 | 2026 | 2027 | 2028 | 2029 | 2030 | 2031 | 2032 | 2033 | |
| Levered FCF (CA$, Millions) | CA$982.4m | CA$1.37b | CA$1.42b | CA$1.46b | CA$1.50b | CA$1.54b | CA$1.58b | CA$1.61b | CA$1.65b | CA$1.68b |
| Growth Rate Estimate Source | Analyst x5 | Analyst x2 | Est @ 3.69% | Est @ 3.16% | Est @ 2.79% | Est @ 2.53% | Est @ 2.35% | Est @ 2.23% | Est @ 2.14% | Est @ 2.07% |
| Present Value (CA$, Millions) Discounted @ 7.8% | CA$911 | CA$1.2k | CA$1.1k | CA$1.1k | CA$1.0k | CA$982 | CA$933 | CA$885 | CA$838 | CA$794 |
("Est" = FCF growth rate estimated by Simply Wall St)
Present Value of 10-year Cash Flow (PVCF) = CA$9.8b
We now need to calculate the Terminal Value, which accounts for all the future cash flows after this ten year period. The Gordon Growth formula is used to calculate Terminal Value at a future annual growth rate equal to the 5-year average of the 10-year government bond yield of 1.9%. We discount the terminal cash flows to today's value at a cost of equity of 7.8%.
Terminal Value (TV)= FCF2033 × (1 + g) ÷ (r – g) = CA$1.7b× (1 + 1.9%) ÷ (7.8%– 1.9%) = CA$29b
Present Value of Terminal Value (PVTV)= TV / (1 + r)10= CA$29b÷ ( 1 + 7.8%)10= CA$14b
The total value, or equity value, is then the sum of the present value of the future cash flows, which in this case is CA$24b. In the final step we divide the equity value by the number of shares outstanding. Relative to the current share price of CA$21.1, the company appears quite undervalued at a 46% discount to where the stock price trades currently. The assumptions in any calculation have a big impact on the valuation, so it is better to view this as a rough estimate, not precise down to the last cent.
Important Assumptions
Now the most important inputs to a discounted cash flow are the discount rate, and of course, the actual cash flows. You don't have to agree with these inputs, I recommend redoing the calculations yourself and playing with them. The DCF also does not consider the possible cyclicality of an industry, or a company's future capital requirements, so it does not give a full picture of a company's potential performance. Given that we are looking at ARC Resources as potential shareholders, the cost of equity is used as the discount rate, rather than the cost of capital (or weighted average cost of capital, WACC) which accounts for debt. In this calculation we've used 7.8%, which is based on a levered beta of 1.174. Beta is a measure of a stock's volatility, compared to the market as a whole. We get our beta from the industry average beta of globally comparable companies, with an imposed limit between 0.8 and 2.0, which is a reasonable range for a stable business.
SWOT Analysis for ARC Resources
- Debt is not viewed as a risk.
- Dividends are covered by earnings and cash flows.
- Earnings declined over the past year.
- Dividend is low compared to the top 25% of dividend payers in the Oil and Gas market.
- Good value based on P/E ratio and estimated fair value.
- No apparent threats visible for ARX.
Moving On:
Valuation is only one side of the coin in terms of building your investment thesis, and it shouldn't be the only metric you look at when researching a company. The DCF model is not a perfect stock valuation tool. Rather it should be seen as a guide to "what assumptions need to be true for this stock to be under/overvalued?" If a company grows at a different rate, or if its cost of equity or risk free rate changes sharply, the output can look very different. What is the reason for the share price sitting below the intrinsic value? For ARC Resources, we've compiled three fundamental aspects you should further examine:
- Risks: For example, we've discovered 2 warning signs for ARC Resources (1 is concerning!) that you should be aware of before investing here.
- Future Earnings: How does ARX's growth rate compare to its peers and the wider market? Dig deeper into the analyst consensus number for the upcoming years by interacting with our free analyst growth expectation chart.
- Other Solid Businesses: Low debt, high returns on equity and good past performance are fundamental to a strong business. Why not explore our interactive list of stocks with solid business fundamentals to see if there are other companies you may not have considered!
PS. The Simply Wall St app conducts a discounted cash flow valuation for every stock on the TSX every day. If you want to find the calculation for other stocks just search here.
New: Manage All Your Stock Portfolios in One Place
We've created the ultimate portfolio companion for stock investors, and it's free.
• Connect an unlimited number of Portfolios and see your total in one currency
• Be alerted to new Warning Signs or Risks via email or mobile
• Track the Fair Value of your stocks
Have feedback on this article? Concerned about the content? Get in touch with us directly. Alternatively, email editorial-team (at) simplywallst.com.
This article by Simply Wall St is general in nature. We provide commentary based on historical data and analyst forecasts only using an unbiased methodology and our articles are not intended to be financial advice. It does not constitute a recommendation to buy or sell any stock, and does not take account of your objectives, or your financial situation. We aim to bring you long-term focused analysis driven by fundamental data. Note that our analysis may not factor in the latest price-sensitive company announcements or qualitative material. Simply Wall St has no position in any stocks mentioned.
About TSX:ARX
ARC Resources
Engages in the acquiring and developing crude oil, natural gas, condensate, and natural gas liquids in Canada.
Undervalued with adequate balance sheet.

