
Advertisement
- Canada
- /
- Oil and Gas
- /
- TSX:ARX
ARC Resources Ltd.'s (TSE:ARX) Stock Is Going Strong: Is the Market Following Fundamentals?

ARC Resources' (TSE:ARX) stock is up by a considerable 8.0% over the past week. Given that the market rewards strong financials in the long-term, we wonder if that is the case in this instance. Specifically, we decided to study ARC Resources' ROE in this article.
ROE or return on equity is a useful tool to assess how effectively a company can generate returns on the investment it received from its shareholders. In other words, it is a profitability ratio which measures the rate of return on the capital provided by the company's shareholders.
View our latest analysis for ARC Resources
How Do You Calculate Return On Equity?
The formula for ROE is:
Return on Equity = Net Profit (from continuing operations) ÷ Shareholders' Equity
So, based on the above formula, the ROE for ARC Resources is:
15% = CA$1.2b ÷ CA$7.6b (Based on the trailing twelve months to June 2024).
The 'return' is the profit over the last twelve months. So, this means that for every CA$1 of its shareholder's investments, the company generates a profit of CA$0.15.
What Is The Relationship Between ROE And Earnings Growth?
We have already established that ROE serves as an efficient profit-generating gauge for a company's future earnings. We now need to evaluate how much profit the company reinvests or "retains" for future growth which then gives us an idea about the growth potential of the company. Generally speaking, other things being equal, firms with a high return on equity and profit retention, have a higher growth rate than firms that don’t share these attributes.
A Side By Side comparison of ARC Resources' Earnings Growth And 15% ROE
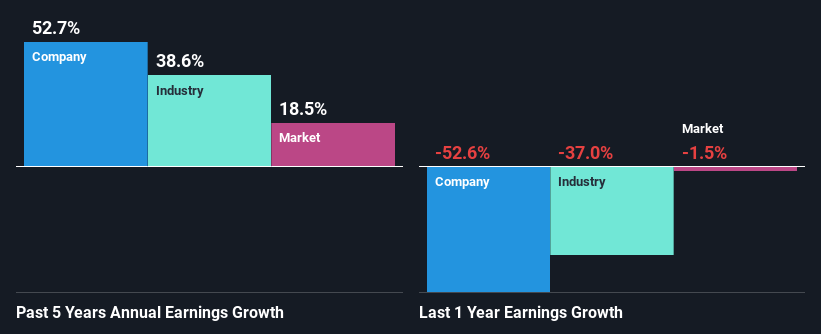
To start with, ARC Resources' ROE looks acceptable. Especially when compared to the industry average of 9.4% the company's ROE looks pretty impressive. This certainly adds some context to ARC Resources' exceptional 53% net income growth seen over the past five years. However, there could also be other causes behind this growth. For instance, the company has a low payout ratio or is being managed efficiently.
Next, on comparing with the industry net income growth, we found that ARC Resources' growth is quite high when compared to the industry average growth of 39% in the same period, which is great to see.
Earnings growth is a huge factor in stock valuation. It’s important for an investor to know whether the market has priced in the company's expected earnings growth (or decline). This then helps them determine if the stock is placed for a bright or bleak future. If you're wondering about ARC Resources''s valuation, check out this gauge of its price-to-earnings ratio, as compared to its industry.
Is ARC Resources Efficiently Re-investing Its Profits?
ARC Resources has a really low three-year median payout ratio of 23%, meaning that it has the remaining 77% left over to reinvest into its business. This suggests that the management is reinvesting most of the profits to grow the business as evidenced by the growth seen by the company.
Moreover, ARC Resources is determined to keep sharing its profits with shareholders which we infer from its long history of paying a dividend for at least ten years. Upon studying the latest analysts' consensus data, we found that the company's future payout ratio is expected to drop to 16% over the next three years. The fact that the company's ROE is expected to rise to 23% over the same period is explained by the drop in the payout ratio.
Conclusion
Overall, we are quite pleased with ARC Resources' performance. In particular, it's great to see that the company is investing heavily into its business and along with a high rate of return, that has resulted in a sizeable growth in its earnings. That being so, a study of the latest analyst forecasts show that the company is expected to see a slowdown in its future earnings growth. To know more about the latest analysts predictions for the company, check out this visualization of analyst forecasts for the company.
New: Manage All Your Stock Portfolios in One Place
We've created the ultimate portfolio companion for stock investors, and it's free.
• Connect an unlimited number of Portfolios and see your total in one currency
• Be alerted to new Warning Signs or Risks via email or mobile
• Track the Fair Value of your stocks
Have feedback on this article? Concerned about the content? Get in touch with us directly. Alternatively, email editorial-team (at) simplywallst.com.
This article by Simply Wall St is general in nature. We provide commentary based on historical data and analyst forecasts only using an unbiased methodology and our articles are not intended to be financial advice. It does not constitute a recommendation to buy or sell any stock, and does not take account of your objectives, or your financial situation. We aim to bring you long-term focused analysis driven by fundamental data. Note that our analysis may not factor in the latest price-sensitive company announcements or qualitative material. Simply Wall St has no position in any stocks mentioned.
About TSX:ARX
ARC Resources
Engages in the acquiring and developing crude oil, natural gas, condensate, and natural gas liquids in Canada.
Very undervalued with proven track record.
Market Insights


Advertisement
Community Narratives
For the Emperor: Why Games Workshop Could Be a Star Investment
Fair Value UK£160.00|0.4% overvalued
RO
Community Contributor
Securitas will boost margins with AI and tech-driven services
Fair Value SEK 260.91|44.5% undervalued
UN
Community Contributor
A Leader in EV Charging with Growth Potential
Fair Value €27.00|17.8% undervalued
TI
Community Contributor