
Advertisement
This article will reflect on the compensation paid to Ken Rotman who has served as CEO of Clairvest Group Inc. (TSE:CVG) since 2018. This analysis will also evaluate the appropriateness of CEO compensation when taking into account the earnings and shareholder returns of the company.
See our latest analysis for Clairvest Group
Comparing Clairvest Group Inc.'s CEO Compensation With the industry
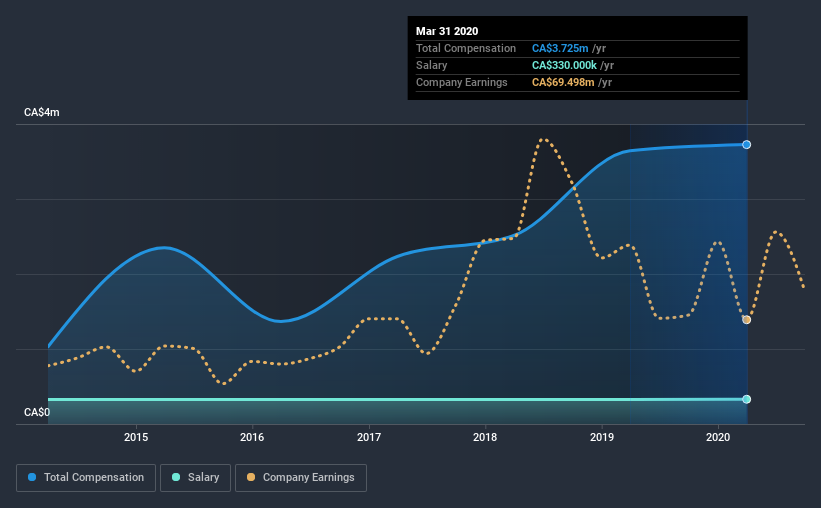
According to our data, Clairvest Group Inc. has a market capitalization of CA$853m, and paid its CEO total annual compensation worth CA$3.7m over the year to March 2020. That's mostly flat as compared to the prior year's compensation. While we always look at total compensation first, our analysis shows that the salary component is less, at CA$330k.
On examining similar-sized companies in the industry with market capitalizations between CA$511m and CA$2.0b, we discovered that the median CEO total compensation of that group was CA$3.5m. This suggests that Clairvest Group remunerates its CEO largely in line with the industry average. What's more, Ken Rotman holds CA$281m worth of shares in the company in their own name, indicating that they have a lot of skin in the game.
| Component | 2020 | 2019 | Proportion (2020) |
| Salary | CA$330k | CA$327k | 9% |
| Other | CA$3.4m | CA$3.3m | 91% |
| Total Compensation | CA$3.7m | CA$3.6m | 100% |
On an industry level, roughly 83% of total compensation represents salary and 17% is other remuneration. Clairvest Group pays a modest slice of remuneration through salary, as compared to the broader industry. If total compensation is slanted towards non-salary benefits, it indicates that CEO pay is linked to company performance.
Clairvest Group Inc.'s Growth
Clairvest Group Inc. has seen its earnings per share (EPS) increase by 3.9% a year over the past three years. Its revenue is down 7.8% over the previous year.
We would prefer it if there was revenue growth, but it is good to see a modest EPS growth at least. These two metrics are moving in different directions, so while it's hard to be confident judging performance, we think the stock is worth watching. We don't have analyst forecasts, but you could get a better understanding of its growth by checking out this more detailed historical graph of earnings, revenue and cash flow.
Has Clairvest Group Inc. Been A Good Investment?
Boasting a total shareholder return of 48% over three years, Clairvest Group Inc. has done well by shareholders. So they may not be at all concerned if the CEO were to be paid more than is normal for companies around the same size.
In Summary...
As we noted earlier, Clairvest Group pays its CEO in line with similar-sized companies belonging to the same industry. However, the company's EPS growth numbers over the last three years is not that impressive. At the same time, shareholder returns have remained strong over the same period. We would like to see EPS growth from the business, although we wouldn't say the CEO compensation is high.
Shareholders may want to check for free if Clairvest Group insiders are buying or selling shares.
Switching gears from Clairvest Group, if you're hunting for a pristine balance sheet and premium returns, this free list of high return, low debt companies is a great place to look.
If you decide to trade Clairvest Group, use the lowest-cost* platform that is rated #1 Overall by Barron’s, Interactive Brokers. Trade stocks, options, futures, forex, bonds and funds on 135 markets, all from a single integrated account. Promoted
New: AI Stock Screener & Alerts
Our new AI Stock Screener scans the market every day to uncover opportunities.
• Dividend Powerhouses (3%+ Yield)
• Undervalued Small Caps with Insider Buying
• High growth Tech and AI Companies
Or build your own from over 50 metrics.
This article by Simply Wall St is general in nature. It does not constitute a recommendation to buy or sell any stock, and does not take account of your objectives, or your financial situation. We aim to bring you long-term focused analysis driven by fundamental data. Note that our analysis may not factor in the latest price-sensitive company announcements or qualitative material. Simply Wall St has no position in any stocks mentioned.
*Interactive Brokers Rated Lowest Cost Broker by StockBrokers.com Annual Online Review 2020
Have feedback on this article? Concerned about the content? Get in touch with us directly. Alternatively, email editorial-team (at) simplywallst.com.
About TSX:CVG
Clairvest Group
A private equity firm specializing in mid-market, growth equity investments, buyouts, industry consolidation and acquisitions.
Flawless balance sheet with proven track record and pays a dividend.
Market Insights

Advertisement
Community Narratives
The Next Phase of Energy Storage: How NeoVolta Is Tackling America’s Power Crunch
Fair Value US$7.50|30.4% undervalued
MA
Community Contributor
Why EnSilica is Worth Possibly 13x its Current Price
Fair Value UK£5.00|89.5% undervalued
DO
Community Contributor
M&A Activity, Industry Diversification & A Defense Contract Monopoly Will Push BWXT For Healthy Long-Term Growth
Fair Value US$220.00|13.0% undervalued
CL
Community Contributor
A case for Cassiar Gold Corp (TSXV: GLDC) to reach CAD$8-10 before 2030 (X30-37)
Fair Value CA$10.00|96.5% undervalued
AG
Community Contributor