- Canada
- /
- Diversified Financial
- /
- CNSX:XSF
Positive Sentiment Still Eludes XS Financial Inc. (CSE:XSF) Following 30% Share Price Slump


The XS Financial Inc. (CSE:XSF) share price has softened a substantial 30% over the previous 30 days, handing back much of the gains the stock has made lately. The drop over the last 30 days has capped off a tough year for shareholders, with the share price down 30% in that time.
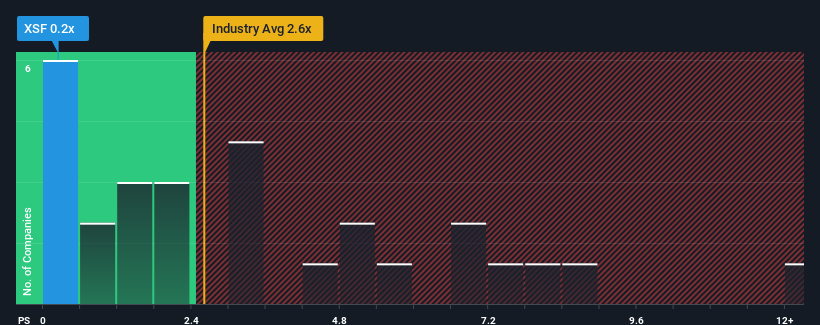
After such a large drop in price, XS Financial's price-to-sales (or "P/S") ratio of 0.2x might make it look like a strong buy right now compared to the wider Diversified Financial industry in Canada, where around half of the companies have P/S ratios above 3.4x and even P/S above 7x are quite common. Nonetheless, we'd need to dig a little deeper to determine if there is a rational basis for the highly reduced P/S.
See our latest analysis for XS Financial
How Has XS Financial Performed Recently?
Recent times have been quite advantageous for XS Financial as its revenue has been rising very briskly. One possibility is that the P/S ratio is low because investors think this strong revenue growth might actually underperform the broader industry in the near future. If you like the company, you'd be hoping this isn't the case so that you could potentially pick up some stock while it's out of favour.
Want the full picture on earnings, revenue and cash flow for the company? Then our free report on XS Financial will help you shine a light on its historical performance.Do Revenue Forecasts Match The Low P/S Ratio?
In order to justify its P/S ratio, XS Financial would need to produce anemic growth that's substantially trailing the industry.
Taking a look back first, we see that the company grew revenue by an impressive 82% last year. Spectacularly, three year revenue growth has ballooned by several orders of magnitude, thanks in part to the last 12 months of revenue growth. Accordingly, shareholders would have been over the moon with those medium-term rates of revenue growth.
When compared to the industry's one-year growth forecast of 34%, the most recent medium-term revenue trajectory is noticeably more alluring
With this information, we find it odd that XS Financial is trading at a P/S lower than the industry. Apparently some shareholders believe the recent performance has exceeded its limits and have been accepting significantly lower selling prices.
The Final Word
XS Financial's P/S looks about as weak as its stock price lately. It's argued the price-to-sales ratio is an inferior measure of value within certain industries, but it can be a powerful business sentiment indicator.
Our examination of XS Financial revealed its three-year revenue trends aren't boosting its P/S anywhere near as much as we would have predicted, given they look better than current industry expectations. When we see robust revenue growth that outpaces the industry, we presume that there are notable underlying risks to the company's future performance, which is exerting downward pressure on the P/S ratio. At least price risks look to be very low if recent medium-term revenue trends continue, but investors seem to think future revenue could see a lot of volatility.
Before you take the next step, you should know about the 3 warning signs for XS Financial that we have uncovered.
It's important to make sure you look for a great company, not just the first idea you come across. So if growing profitability aligns with your idea of a great company, take a peek at this free list of interesting companies with strong recent earnings growth (and a low P/E).
If you're looking to trade XS Financial, open an account with the lowest-cost platform trusted by professionals, Interactive Brokers.
With clients in over 200 countries and territories, and access to 160 markets, IBKR lets you trade stocks, options, futures, forex, bonds and funds from a single integrated account.
Enjoy no hidden fees, no account minimums, and FX conversion rates as low as 0.03%, far better than what most brokers offer.
Sponsored ContentNew: AI Stock Screener & Alerts
Our new AI Stock Screener scans the market every day to uncover opportunities.
• Dividend Powerhouses (3%+ Yield)
• Undervalued Small Caps with Insider Buying
• High growth Tech and AI Companies
Or build your own from over 50 metrics.
Have feedback on this article? Concerned about the content? Get in touch with us directly. Alternatively, email editorial-team (at) simplywallst.com.
This article by Simply Wall St is general in nature. We provide commentary based on historical data and analyst forecasts only using an unbiased methodology and our articles are not intended to be financial advice. It does not constitute a recommendation to buy or sell any stock, and does not take account of your objectives, or your financial situation. We aim to bring you long-term focused analysis driven by fundamental data. Note that our analysis may not factor in the latest price-sensitive company announcements or qualitative material. Simply Wall St has no position in any stocks mentioned.
About CNSX:XSF
XS Financial
A specialty finance company, provides equipment leasing solutions in the United States.
Adequate balance sheet and slightly overvalued.
Market Insights

Community Narratives

