
Advertisement
Even when a business is losing money, it's possible for shareholders to make money if they buy a good business at the right price. For example, although Amazon.com made losses for many years after listing, if you had bought and held the shares since 1999, you would have made a fortune. But the harsh reality is that very many loss making companies burn through all their cash and go bankrupt.
So should Rivalry (CVE:RVLY) shareholders be worried about its cash burn? In this report, we will consider the company's annual negative free cash flow, henceforth referring to it as the 'cash burn'. First, we'll determine its cash runway by comparing its cash burn with its cash reserves.
View our latest analysis for Rivalry
How Long Is Rivalry's Cash Runway?
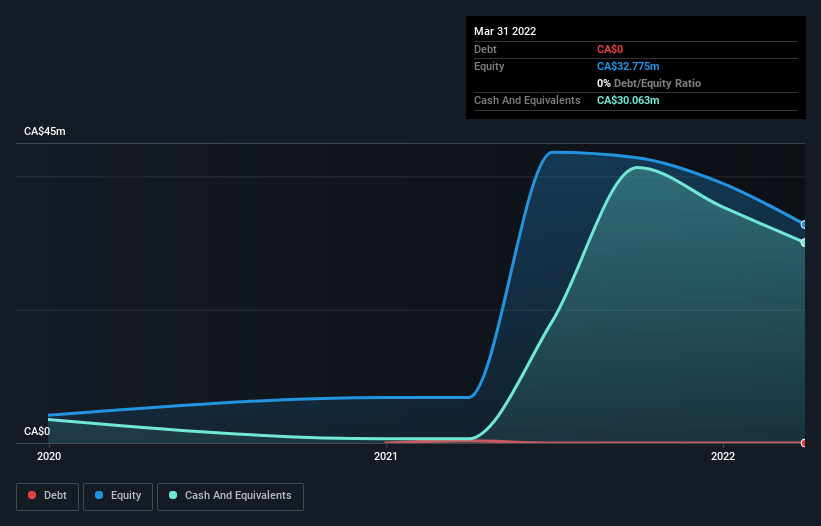
A cash runway is defined as the length of time it would take a company to run out of money if it kept spending at its current rate of cash burn. In March 2022, Rivalry had CA$30m in cash, and was debt-free. Looking at the last year, the company burnt through CA$18m. Therefore, from March 2022 it had roughly 20 months of cash runway. While that cash runway isn't too concerning, sensible holders would be peering into the distance, and considering what happens if the company runs out of cash. The image below shows how its cash balance has been changing over the last few years.
How Well Is Rivalry Growing?
Notably, Rivalry actually ramped up its cash burn very hard and fast in the last year, by 130%, signifying heavy investment in the business. But shareholders are no doubt taking some confidence from the rockstar revenue growth of 354% during that same year. Considering the factors above, the company doesn’t fare badly when it comes to assessing how it is changing over time. While the past is always worth studying, it is the future that matters most of all. So you might want to take a peek at how much the company is expected to grow in the next few years.
Can Rivalry Raise More Cash Easily?
Even though it seems like Rivalry is developing its business nicely, we still like to consider how easily it could raise more money to accelerate growth. Companies can raise capital through either debt or equity. Commonly, a business will sell new shares in itself to raise cash and drive growth. We can compare a company's cash burn to its market capitalisation to get a sense for how many new shares a company would have to issue to fund one year's operations.
Since it has a market capitalisation of CA$54m, Rivalry's CA$18m in cash burn equates to about 34% of its market value. That's not insignificant, and if the company had to sell enough shares to fund another year's growth at the current share price, you'd likely witness fairly costly dilution.
So, Should We Worry About Rivalry's Cash Burn?
Even though its increasing cash burn makes us a little nervous, we are compelled to mention that we thought Rivalry's revenue growth was relatively promising. Even though we don't think it has a problem with its cash burn, the analysis we've done in this article does suggest that shareholders should give some careful thought to the potential cost of raising more money in the future. Taking an in-depth view of risks, we've identified 1 warning sign for Rivalry that you should be aware of before investing.
Of course, you might find a fantastic investment by looking elsewhere. So take a peek at this free list of interesting companies, and this list of stocks growth stocks (according to analyst forecasts)
New: AI Stock Screener & Alerts
Our new AI Stock Screener scans the market every day to uncover opportunities.
• Dividend Powerhouses (3%+ Yield)
• Undervalued Small Caps with Insider Buying
• High growth Tech and AI Companies
Or build your own from over 50 metrics.
Have feedback on this article? Concerned about the content? Get in touch with us directly. Alternatively, email editorial-team (at) simplywallst.com.
This article by Simply Wall St is general in nature. We provide commentary based on historical data and analyst forecasts only using an unbiased methodology and our articles are not intended to be financial advice. It does not constitute a recommendation to buy or sell any stock, and does not take account of your objectives, or your financial situation. We aim to bring you long-term focused analysis driven by fundamental data. Note that our analysis may not factor in the latest price-sensitive company announcements or qualitative material. Simply Wall St has no position in any stocks mentioned.
About TSXV:RVLY
Rivalry
Through its subsidiaries, operates as an esports and sports betting company in Canada and internationally.
Medium-low risk and overvalued.
Similar Companies
Market Insights

Advertisement
Weekly Picks
RO


RockeTeller on Santacruz Silver Mining ·
Crazy Undervalued 42 Baggers Silver Play (Active & Running Mine)
Fair Value:CA$8696.7% undervalued
50 followersusers have followed this narrative
6 commentsusers have commented on this narrative
16 likesusers have liked this narrative
RO


Robbo on Fiducian Group ·
Fiducian: Compliance Clouds or Value Opportunity?
Fair Value:AU$122.0% undervalued
7 followersusers have followed this narrative
0 commentsusers have commented on this narrative
0 likesusers have liked this narrative
WO

woodworthfund on Willamette Valley Vineyards ·
Willamette Valley Vineyards (WVVI): Not-So-Great Value
Fair Value:US$242.5% overvalued
10 followersusers have followed this narrative
0 commentsusers have commented on this narrative
1 likeusers have liked this narrative
Recently Updated Narratives
MO


mo7md on ADNOC Gas ·
ADNOC Gas future shines with a 21.4% revenue surge
Fair Value:د.إ3.728.9% undervalued
1 followerusers have followed this narrative
0 commentsusers have commented on this narrative
0 likesusers have liked this narrative
IN

IncomeAssets on Pulse Seismic ·
Watch Pulse Seismic Outperform with 13.6% Revenue Growth in the Coming Years
Fair Value:CA$4.4727.3% undervalued
3 followersusers have followed this narrative
0 commentsusers have commented on this narrative
0 likesusers have liked this narrative
VL

Vladislav on Galleon Gold ·
Significantly undervalued gold explorer in Timmins, finally getting traction
Fair Value:CA$481.5% undervalued
6 followersusers have followed this narrative
0 commentsusers have commented on this narrative
0 likesusers have liked this narrative
Popular Narratives
TH


TheWallstreetKing on MicroVision ·
MicroVision will explode future revenue by 380.37% with a vision towards success
Fair Value:US$6098.5% undervalued
116 followersusers have followed this narrative
11 commentsusers have commented on this narrative
22 likesusers have liked this narrative
AN


AnalystConsensusTarget on NVIDIA ·
NVDA: Expanding AI Demand Will Drive Major Data Center Investments Through 2026
Fair Value:US$250.3927.2% undervalued
957 followersusers have followed this narrative
6 commentsusers have commented on this narrative
25 likesusers have liked this narrative
RO
RockeTeller on Santacruz Silver Mining ·
Crazy Undervalued 42 Baggers Silver Play (Active & Running Mine)
Fair Value:CA$8696.7% undervalued
50 followersusers have followed this narrative
6 commentsusers have commented on this narrative
16 likesusers have liked this narrative

