
Advertisement
- Canada
- /
- Hospitality
- /
- TSX:QSP.UN
A Look At The Fair Value Of Restaurant Brands International Limited Partnership (TSE:QSP.UN)

Key Insights
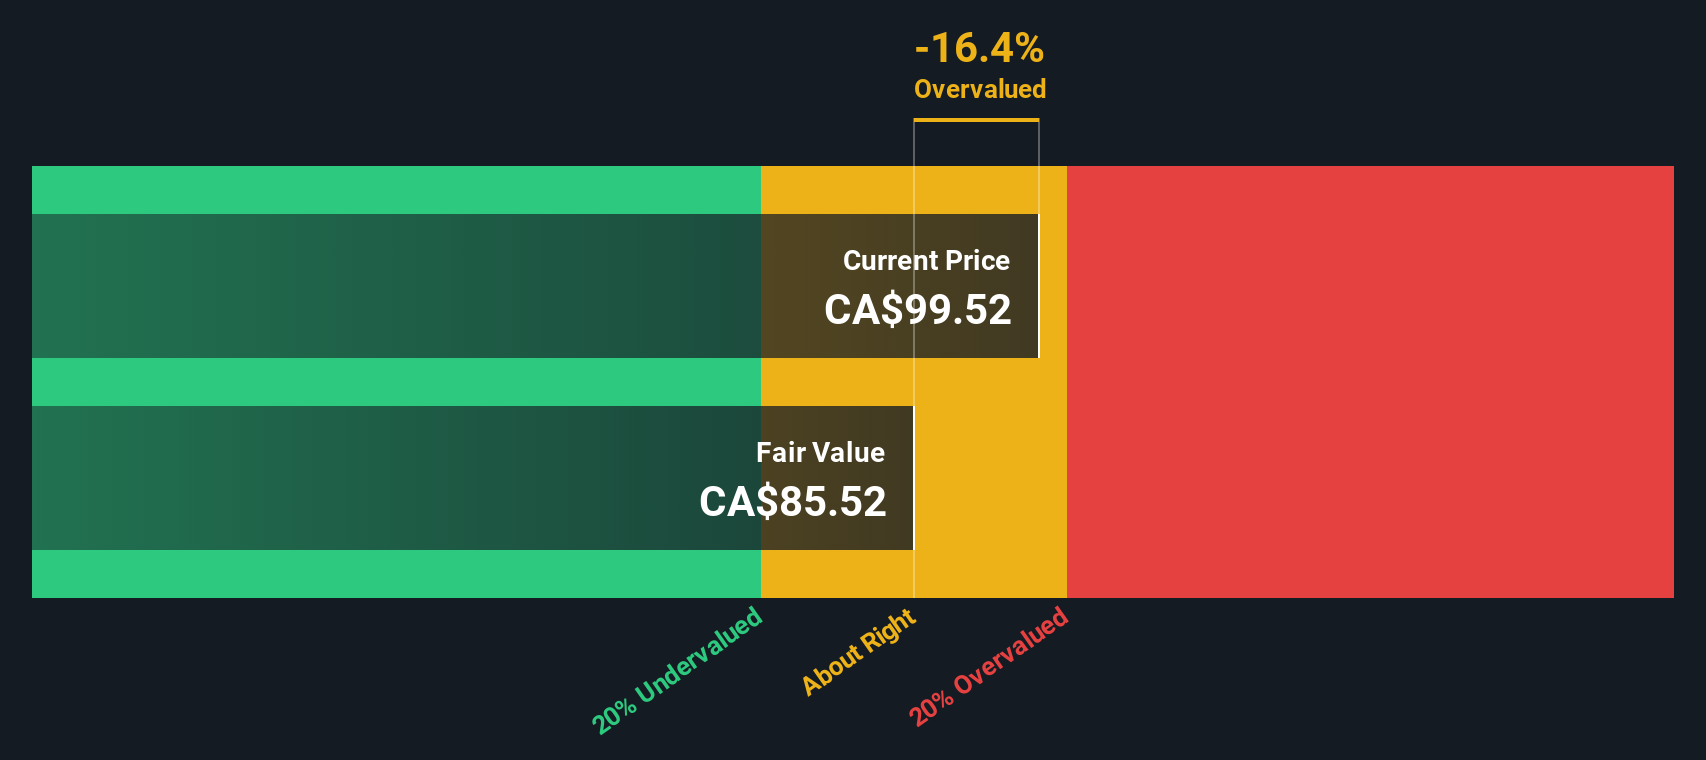
- Using the 2 Stage Free Cash Flow to Equity, Restaurant Brands International Limited Partnership fair value estimate is CA$85.52
- Restaurant Brands International Limited Partnership's CA$99.52 share price indicates it is trading at similar levels as its fair value estimate
- When compared to theindustry average discount of -9.3%, Restaurant Brands International Limited Partnership's competitors seem to be trading at a lesser premium to fair value
Today we will run through one way of estimating the intrinsic value of Restaurant Brands International Limited Partnership (TSE:QSP.UN) by taking the expected future cash flows and discounting them to their present value. We will use the Discounted Cash Flow (DCF) model on this occasion. There's really not all that much to it, even though it might appear quite complex.
We would caution that there are many ways of valuing a company and, like the DCF, each technique has advantages and disadvantages in certain scenarios. For those who are keen learners of equity analysis, the Simply Wall St analysis model here may be something of interest to you.
The Model
We're using the 2-stage growth model, which simply means we take in account two stages of company's growth. In the initial period the company may have a higher growth rate and the second stage is usually assumed to have a stable growth rate. To start off with, we need to estimate the next ten years of cash flows. Seeing as no analyst estimates of free cash flow are available to us, we have extrapolate the previous free cash flow (FCF) from the company's last reported value. We assume companies with shrinking free cash flow will slow their rate of shrinkage, and that companies with growing free cash flow will see their growth rate slow, over this period. We do this to reflect that growth tends to slow more in the early years than it does in later years.
Generally we assume that a dollar today is more valuable than a dollar in the future, and so the sum of these future cash flows is then discounted to today's value:
10-year free cash flow (FCF) estimate
| 2025 | 2026 | 2027 | 2028 | 2029 | 2030 | 2031 | 2032 | 2033 | 2034 | |
| Levered FCF ($, Millions) | US$1.29b | US$1.32b | US$1.35b | US$1.38b | US$1.42b | US$1.45b | US$1.49b | US$1.52b | US$1.56b | US$1.60b |
| Growth Rate Estimate Source | Est @ 2.20% | Est @ 2.29% | Est @ 2.35% | Est @ 2.39% | Est @ 2.42% | Est @ 2.44% | Est @ 2.46% | Est @ 2.47% | Est @ 2.47% | Est @ 2.48% |
| Present Value ($, Millions) Discounted @ 8.8% | US$1.2k | US$1.1k | US$1.0k | US$986 | US$928 | US$874 | US$823 | US$775 | US$730 | US$687 |
("Est" = FCF growth rate estimated by Simply Wall St)
Present Value of 10-year Cash Flow (PVCF) = US$9.2b
We now need to calculate the Terminal Value, which accounts for all the future cash flows after this ten year period. For a number of reasons a very conservative growth rate is used that cannot exceed that of a country's GDP growth. In this case we have used the 5-year average of the 10-year government bond yield (2.5%) to estimate future growth. In the same way as with the 10-year 'growth' period, we discount future cash flows to today's value, using a cost of equity of 8.8%.
Terminal Value (TV)= FCF2034 × (1 + g) ÷ (r – g) = US$1.6b× (1 + 2.5%) ÷ (8.8%– 2.5%) = US$26b
Present Value of Terminal Value (PVTV)= TV / (1 + r)10= US$26b÷ ( 1 + 8.8%)10= US$11b
The total value, or equity value, is then the sum of the present value of the future cash flows, which in this case is US$20b. To get the intrinsic value per share, we divide this by the total number of shares outstanding. Compared to the current share price of CA$99.5, the company appears around fair value at the time of writing. Remember though, that this is just an approximate valuation, and like any complex formula - garbage in, garbage out.
The Assumptions
Now the most important inputs to a discounted cash flow are the discount rate, and of course, the actual cash flows. Part of investing is coming up with your own evaluation of a company's future performance, so try the calculation yourself and check your own assumptions. The DCF also does not consider the possible cyclicality of an industry, or a company's future capital requirements, so it does not give a full picture of a company's potential performance. Given that we are looking at Restaurant Brands International Limited Partnership as potential shareholders, the cost of equity is used as the discount rate, rather than the cost of capital (or weighted average cost of capital, WACC) which accounts for debt. In this calculation we've used 8.8%, which is based on a levered beta of 1.461. Beta is a measure of a stock's volatility, compared to the market as a whole. We get our beta from the industry average beta of globally comparable companies, with an imposed limit between 0.8 and 2.0, which is a reasonable range for a stable business.
View our latest analysis for Restaurant Brands International Limited Partnership
SWOT Analysis for Restaurant Brands International Limited Partnership
Strength
- Debt is well covered by earnings.
- Dividends are covered by earnings and cash flows.
Weakness
- Earnings declined over the past year.
- Dividend is low compared to the top 25% of dividend payers in the Hospitality market.
- Current share price is above our estimate of fair value.
Opportunity
- QSP.UN's financial characteristics indicate limited near-term opportunities for shareholders.
- Lack of analyst coverage makes it difficult to determine QSP.UN's earnings prospects.
Threat
- Debt is not well covered by operating cash flow.

Next Steps:
Although the valuation of a company is important, it ideally won't be the sole piece of analysis you scrutinize for a company. The DCF model is not a perfect stock valuation tool. Rather it should be seen as a guide to "what assumptions need to be true for this stock to be under/overvalued?" If a company grows at a different rate, or if its cost of equity or risk free rate changes sharply, the output can look very different. For Restaurant Brands International Limited Partnership, we've put together three pertinent items you should assess:
- Risks: We feel that you should assess the 3 warning signs for Restaurant Brands International Limited Partnership (2 are a bit unpleasant!) we've flagged before making an investment in the company.
- Other High Quality Alternatives: Do you like a good all-rounder? Explore our interactive list of high quality stocks to get an idea of what else is out there you may be missing!
- Other Top Analyst Picks: Interested to see what the analysts are thinking? Take a look at our interactive list of analysts' top stock picks to find out what they feel might have an attractive future outlook!
PS. Simply Wall St updates its DCF calculation for every Canadian stock every day, so if you want to find the intrinsic value of any other stock just search here.
New: AI Stock Screener & Alerts
Our new AI Stock Screener scans the market every day to uncover opportunities.
• Dividend Powerhouses (3%+ Yield)
• Undervalued Small Caps with Insider Buying
• High growth Tech and AI Companies
Or build your own from over 50 metrics.
Have feedback on this article? Concerned about the content? Get in touch with us directly. Alternatively, email editorial-team (at) simplywallst.com.
This article by Simply Wall St is general in nature. We provide commentary based on historical data and analyst forecasts only using an unbiased methodology and our articles are not intended to be financial advice. It does not constitute a recommendation to buy or sell any stock, and does not take account of your objectives, or your financial situation. We aim to bring you long-term focused analysis driven by fundamental data. Note that our analysis may not factor in the latest price-sensitive company announcements or qualitative material. Simply Wall St has no position in any stocks mentioned.
About TSX:QSP.UN
Restaurant Brands International Limited Partnership
Operates and franchises quick service restaurants in the United States and internationally.
Established dividend payer low.
Similar Companies
Market Insights

Advertisement
Community Narratives
Pinterest will surge as advertising innovations ignite revenue growth
Fair Value US$42.63|27.1% undervalued
BR
Community Contributor
Brambles' Revenue Set to Climb 14% with Profit Margins Following
Fair Value AU$21.90|5.9% overvalued
RO
Community Contributor
Challenging Future for STG as Organic Sales Decline by 8.8%
Fair Value DKK 116.13|26.8% undervalued
KA
Community Contributor