
Advertisement
- Canada
- /
- Food and Staples Retail
- /
- TSX:EMP.A
A Look At The Intrinsic Value Of Empire Company Limited (TSE:EMP.A)

Key Insights
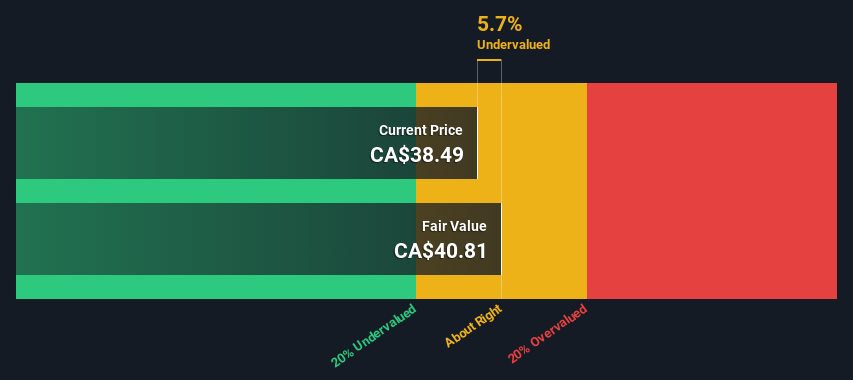
- The projected fair value for Empire is CA$40.81 based on 2 Stage Free Cash Flow to Equity
- Empire's CA$38.49 share price indicates it is trading at similar levels as its fair value estimate
- Analyst price target for EMP.A is CA$39.43 which is 3.4% below our fair value estimate
Today we'll do a simple run through of a valuation method used to estimate the attractiveness of Empire Company Limited (TSE:EMP.A) as an investment opportunity by estimating the company's future cash flows and discounting them to their present value. The Discounted Cash Flow (DCF) model is the tool we will apply to do this. Believe it or not, it's not too difficult to follow, as you'll see from our example!
We generally believe that a company's value is the present value of all of the cash it will generate in the future. However, a DCF is just one valuation metric among many, and it is not without flaws. If you still have some burning questions about this type of valuation, take a look at the Simply Wall St analysis model.
View our latest analysis for Empire
What's The Estimated Valuation?
We're using the 2-stage growth model, which simply means we take in account two stages of company's growth. In the initial period the company may have a higher growth rate and the second stage is usually assumed to have a stable growth rate. In the first stage we need to estimate the cash flows to the business over the next ten years. Where possible we use analyst estimates, but when these aren't available we extrapolate the previous free cash flow (FCF) from the last estimate or reported value. We assume companies with shrinking free cash flow will slow their rate of shrinkage, and that companies with growing free cash flow will see their growth rate slow, over this period. We do this to reflect that growth tends to slow more in the early years than it does in later years.
Generally we assume that a dollar today is more valuable than a dollar in the future, so we discount the value of these future cash flows to their estimated value in today's dollars:
10-year free cash flow (FCF) estimate
| 2025 | 2026 | 2027 | 2028 | 2029 | 2030 | 2031 | 2032 | 2033 | 2034 | |
| Levered FCF (CA$, Millions) | CA$491.5m | CA$607.0m | CA$534.3m | CA$493.0m | CA$469.6m | CA$457.0m | CA$451.4m | CA$450.5m | CA$452.8m | CA$457.4m |
| Growth Rate Estimate Source | Analyst x2 | Analyst x2 | Est @ -11.98% | Est @ -7.73% | Est @ -4.76% | Est @ -2.68% | Est @ -1.22% | Est @ -0.20% | Est @ 0.51% | Est @ 1.01% |
| Present Value (CA$, Millions) Discounted @ 6.3% | CA$462 | CA$537 | CA$445 | CA$387 | CA$346 | CA$317 | CA$295 | CA$277 | CA$262 | CA$249 |
("Est" = FCF growth rate estimated by Simply Wall St)
Present Value of 10-year Cash Flow (PVCF) = CA$3.6b
We now need to calculate the Terminal Value, which accounts for all the future cash flows after this ten year period. The Gordon Growth formula is used to calculate Terminal Value at a future annual growth rate equal to the 5-year average of the 10-year government bond yield of 2.2%. We discount the terminal cash flows to today's value at a cost of equity of 6.3%.
Terminal Value (TV)= FCF2034 × (1 + g) ÷ (r – g) = CA$457m× (1 + 2.2%) ÷ (6.3%– 2.2%) = CA$11b
Present Value of Terminal Value (PVTV)= TV / (1 + r)10= CA$11b÷ ( 1 + 6.3%)10= CA$6.2b
The total value, or equity value, is then the sum of the present value of the future cash flows, which in this case is CA$9.8b. The last step is to then divide the equity value by the number of shares outstanding. Relative to the current share price of CA$38.5, the company appears about fair value at a 5.7% discount to where the stock price trades currently. The assumptions in any calculation have a big impact on the valuation, so it is better to view this as a rough estimate, not precise down to the last cent.
The Assumptions
The calculation above is very dependent on two assumptions. The first is the discount rate and the other is the cash flows. Part of investing is coming up with your own evaluation of a company's future performance, so try the calculation yourself and check your own assumptions. The DCF also does not consider the possible cyclicality of an industry, or a company's future capital requirements, so it does not give a full picture of a company's potential performance. Given that we are looking at Empire as potential shareholders, the cost of equity is used as the discount rate, rather than the cost of capital (or weighted average cost of capital, WACC) which accounts for debt. In this calculation we've used 6.3%, which is based on a levered beta of 0.993. Beta is a measure of a stock's volatility, compared to the market as a whole. We get our beta from the industry average beta of globally comparable companies, with an imposed limit between 0.8 and 2.0, which is a reasonable range for a stable business.
SWOT Analysis for Empire
Strength
- Earnings growth over the past year exceeded the industry.
- Debt is not viewed as a risk.
- Dividends are covered by earnings and cash flows.
Weakness
- Earnings growth over the past year is below its 5-year average.
- Dividend is low compared to the top 25% of dividend payers in the Consumer Retailing market.
Opportunity
- Current share price is below our estimate of fair value.
Threat
- Annual revenue is forecast to grow slower than the Canadian market.
Looking Ahead:
Whilst important, the DCF calculation shouldn't be the only metric you look at when researching a company. It's not possible to obtain a foolproof valuation with a DCF model. Preferably you'd apply different cases and assumptions and see how they would impact the company's valuation. For example, changes in the company's cost of equity or the risk free rate can significantly impact the valuation. For Empire, we've put together three important items you should further research:
- Risks: Every company has them, and we've spotted 1 warning sign for Empire you should know about.
- Management:Have insiders been ramping up their shares to take advantage of the market's sentiment for EMP.A's future outlook? Check out our management and board analysis with insights on CEO compensation and governance factors.
- Other High Quality Alternatives: Do you like a good all-rounder? Explore our interactive list of high quality stocks to get an idea of what else is out there you may be missing!
PS. Simply Wall St updates its DCF calculation for every Canadian stock every day, so if you want to find the intrinsic value of any other stock just search here.
Valuation is complex, but we're here to simplify it.
Discover if Empire might be undervalued or overvalued with our detailed analysis, featuring fair value estimates, potential risks, dividends, insider trades, and its financial condition.
Access Free AnalysisHave feedback on this article? Concerned about the content? Get in touch with us directly. Alternatively, email editorial-team (at) simplywallst.com.
This article by Simply Wall St is general in nature. We provide commentary based on historical data and analyst forecasts only using an unbiased methodology and our articles are not intended to be financial advice. It does not constitute a recommendation to buy or sell any stock, and does not take account of your objectives, or your financial situation. We aim to bring you long-term focused analysis driven by fundamental data. Note that our analysis may not factor in the latest price-sensitive company announcements or qualitative material. Simply Wall St has no position in any stocks mentioned.
About TSX:EMP.A
Empire
Engages in the food retail and related real estate businesses in Canada.
Adequate balance sheet average dividend payer.
Similar Companies
Market Insights


Advertisement
Community Narratives
Pole position to benefit from GENIUS Act
Fair Value US$233.04|58.8% undervalued
CH
Community Contributor
IREN will transform from bitcoin miner to leader in AI infrastructure
Fair Value US$21.48|17.5% undervalued
KA
Community Contributor
Behind the Assay: XRF Scientific’s Role in Modern Mining Economics
Fair Value AU$2.10|2.4% undervalued
RO
Community Contributor