
Advertisement
Warren Buffett famously said, 'Volatility is far from synonymous with risk.' So it might be obvious that you need to consider debt, when you think about how risky any given stock is, because too much debt can sink a company. We can see that CareRx Corporation (TSE:CRRX) does use debt in its business. But the more important question is: how much risk is that debt creating?
When Is Debt Dangerous?
Debt is a tool to help businesses grow, but if a business is incapable of paying off its lenders, then it exists at their mercy. If things get really bad, the lenders can take control of the business. However, a more common (but still painful) scenario is that it has to raise new equity capital at a low price, thus permanently diluting shareholders. By replacing dilution, though, debt can be an extremely good tool for businesses that need capital to invest in growth at high rates of return. The first thing to do when considering how much debt a business uses is to look at its cash and debt together.
See our latest analysis for CareRx
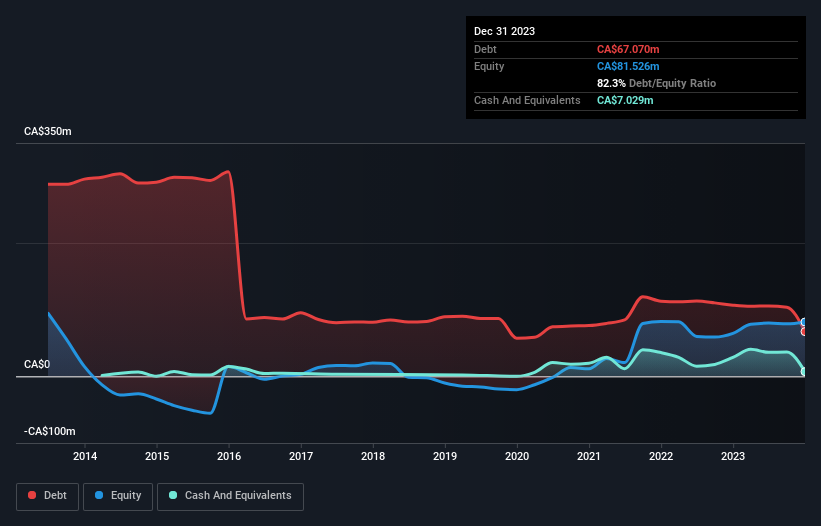
What Is CareRx's Net Debt?
As you can see below, CareRx had CA$67.1m of debt at December 2023, down from CA$106.8m a year prior. On the flip side, it has CA$7.03m in cash leading to net debt of about CA$60.0m.
How Healthy Is CareRx's Balance Sheet?
Zooming in on the latest balance sheet data, we can see that CareRx had liabilities of CA$62.4m due within 12 months and liabilities of CA$87.9m due beyond that. On the other hand, it had cash of CA$7.03m and CA$36.1m worth of receivables due within a year. So it has liabilities totalling CA$107.2m more than its cash and near-term receivables, combined.
This is a mountain of leverage relative to its market capitalization of CA$134.8m. This suggests shareholders would be heavily diluted if the company needed to shore up its balance sheet in a hurry.
We measure a company's debt load relative to its earnings power by looking at its net debt divided by its earnings before interest, tax, depreciation, and amortization (EBITDA) and by calculating how easily its earnings before interest and tax (EBIT) cover its interest expense (interest cover). The advantage of this approach is that we take into account both the absolute quantum of debt (with net debt to EBITDA) and the actual interest expenses associated with that debt (with its interest cover ratio).
While we wouldn't worry about CareRx's net debt to EBITDA ratio of 2.6, we think its super-low interest cover of 0.54 times is a sign of high leverage. It seems that the business incurs large depreciation and amortisation charges, so maybe its debt load is heavier than it would first appear, since EBITDA is arguably a generous measure of earnings. It seems clear that the cost of borrowing money is negatively impacting returns for shareholders, of late. More concerning, CareRx saw its EBIT drop by 7.6% in the last twelve months. If it keeps going like that paying off its debt will be like running on a treadmill -- a lot of effort for not much advancement. The balance sheet is clearly the area to focus on when you are analysing debt. But it is future earnings, more than anything, that will determine CareRx's ability to maintain a healthy balance sheet going forward. So if you're focused on the future you can check out this free report showing analyst profit forecasts.
But our final consideration is also important, because a company cannot pay debt with paper profits; it needs cold hard cash. So we always check how much of that EBIT is translated into free cash flow. Happily for any shareholders, CareRx actually produced more free cash flow than EBIT over the last three years. There's nothing better than incoming cash when it comes to staying in your lenders' good graces.
Our View
CareRx's interest cover and level of total liabilities definitely weigh on it, in our esteem. But the good news is it seems to be able to convert EBIT to free cash flow with ease. When we consider all the factors discussed, it seems to us that CareRx is taking some risks with its use of debt. While that debt can boost returns, we think the company has enough leverage now. When analysing debt levels, the balance sheet is the obvious place to start. However, not all investment risk resides within the balance sheet - far from it. We've identified 3 warning signs with CareRx , and understanding them should be part of your investment process.
At the end of the day, it's often better to focus on companies that are free from net debt. You can access our special list of such companies (all with a track record of profit growth). It's free.
New: AI Stock Screener & Alerts
Our new AI Stock Screener scans the market every day to uncover opportunities.
• Dividend Powerhouses (3%+ Yield)
• Undervalued Small Caps with Insider Buying
• High growth Tech and AI Companies
Or build your own from over 50 metrics.
Have feedback on this article? Concerned about the content? Get in touch with us directly. Alternatively, email editorial-team (at) simplywallst.com.
This article by Simply Wall St is general in nature. We provide commentary based on historical data and analyst forecasts only using an unbiased methodology and our articles are not intended to be financial advice. It does not constitute a recommendation to buy or sell any stock, and does not take account of your objectives, or your financial situation. We aim to bring you long-term focused analysis driven by fundamental data. Note that our analysis may not factor in the latest price-sensitive company announcements or qualitative material. Simply Wall St has no position in any stocks mentioned.
About TSX:CRRX
CareRx
Provides pharmacy services to senior homes and other congregate care settings in Canada.
Reasonable growth potential with adequate balance sheet.
Similar Companies
Market Insights

Advertisement
Community Narratives
Finding The True Value Of A Logistics Powerhouse
Fair Value US$95.21|8.5% undervalued
NV
Community Contributor
Paradigm Biopharmaceuticals Will Lead Osteoarthritis Treatment with Zilosul's FDA Success
Fair Value AU$5.50|91.8% undervalued
AM
Community Contributor
Barrick Mining (ABX:CA): A Gold Hedge against a U.S. Shutdown
Fair Value CA$60.00|26.5% undervalued
GM
Community Contributor